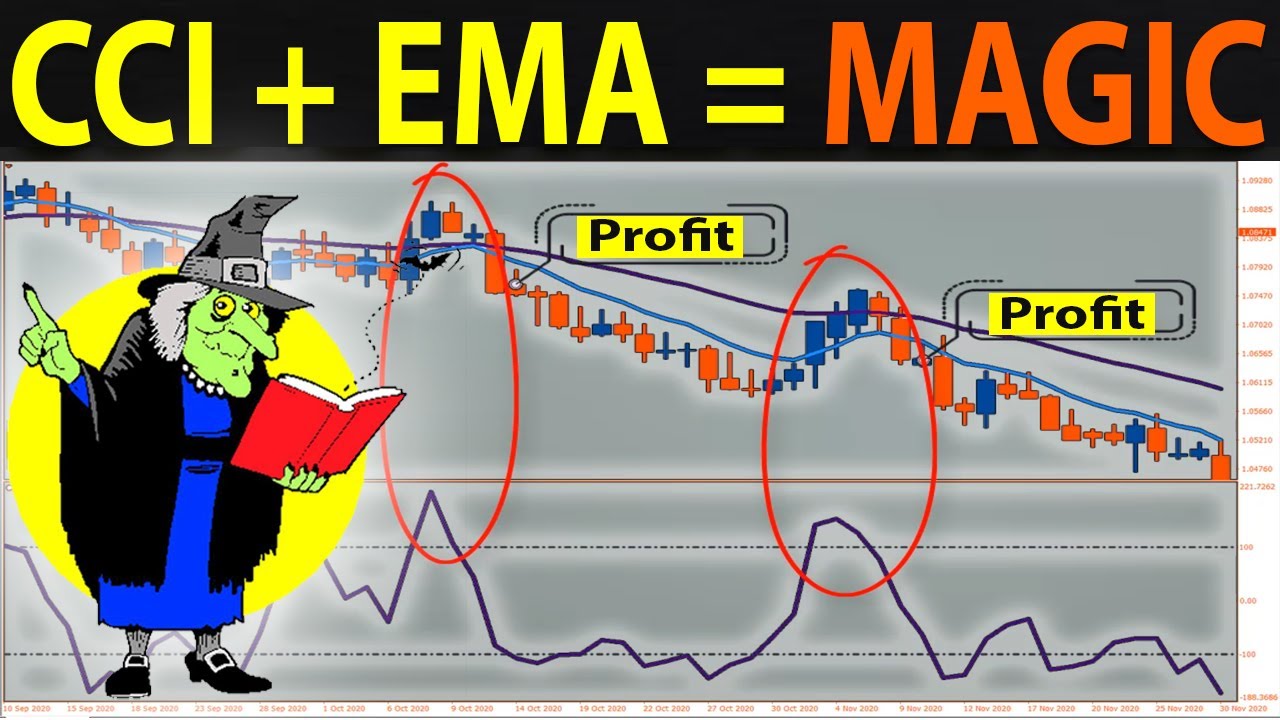
Learn about the high probability CCI moving average crossover trading strategy and how it can be combined with price action in this in-depth video. The strategy works well in volatile under trending markets but not so well during ranging markets. The CCI trend indicator is used to determine the strength of the trend, and when combined with other trend indicators such as moving averages, can help to time entry points into a trend. The CCI moving average crossover trading strategy uses two exponential moving averages (10 and 30) and a CCI with a setting of 7. The strategy can be used for currency trading, stock trading, and crypto, and the rules for selling and buying positions are explained in detail.
High Probability CCI Moving Average Crossover Trading Strategy: A Comprehensive Guide to Trading
Introduction
In this video, we will go in-depth about the high probability CCI moving average crossover trading strategy and how it can be used in combination with price action. This strategy can be used for trading currency, stocks and crypto, as price action stays consistent across different assets.
CCI Moving Average Crossover Trading Strategy
The logic behind the CCI moving average crossover trading strategy is simple. It combines both a trend following indicator and an oversold/overbought indicator. Moving averages can show you the approximate trend and change of trend when the crossover occurs, while CCI is an oscillator that shows whether the market is oversold or overbought. The CCI moving average crossover is one of the most effective price action strategies that you can use in the market, allowing traders to determine if they want to enter, exit or refrain from taking a trade, or add to an existing position.
Moving Average Crossover
Moving averages are lagging indicators, and crossover techniques may not capture exact tops and bottoms, but they can help you identify the bulk of a trend. Moving average crossovers offer specific triggers for potential entry and exit points, which should be confirmed by chart pattern and indicators. Traders should use one or two indicators that complement their trading strategy to confirm high probability trades. Overcomplicating analysis by adding multiple indicators to one chart can be counterproductive.
Using CCI as a Trend Indicator
The Commodity Channel Index (CCI) is a momentum-based oscillator that helps determine when an investment vehicle is reaching a condition of being overbought or oversold. Developed by Donald Lambert, this technical indicator can assess the price trend direction and strength, allowing traders to determine if they want to enter or exit a trade, refrain from taking a trade or add to an existing position. When a trend exhibits strong momentum, there is a high probability that the price will continue rising or falling. Traders can use the CCI as a trend indicator to time their entries into a trend.
CCI Moving Average Crossover Trading Strategy Details
When using the CCI moving average crossover trading strategy, you can use any time frame, but consider the amount of noise on lower time frames. It is recommended that you consider using 15-minute charts and higher. You will need only two trading indicators, the first two exponential moving averages set at 30 and 10, and the second is the CCI, set at seven. Do not add any other technical indicators to this mix.
Trading Strategy Rules
To implement this strategy, you need to ensure you fully test the rules so that you can apply them without thinking. For short positions, wait for the 10 EMA to cross the 30 EMA to the downside. Then, wait for the price to rally back to the moving averages. The CCI should be above the 100 level and start to cross below it. If all three points line up, it indicates a sell setup, and you may want to use a price action entry, such as a bearish reversal pattern, to confirm the trading signal. For long positions, look for the opposite signals.
Conclusion
The CCI moving average crossover trading strategy is one of the most effective price action strategies that traders can use in the market. It allows traders to determine whether to enter or exit a trade, refrain from taking a trade, or add to an existing position. Overcomplicating the analysis by adding multiple indicators to a single chart can be counterproductive. Combining the CCI with other trend indicators, such as moving averages, can time the entries within a trend, helping traders pick bottoms in a rally or tops in a decline.

