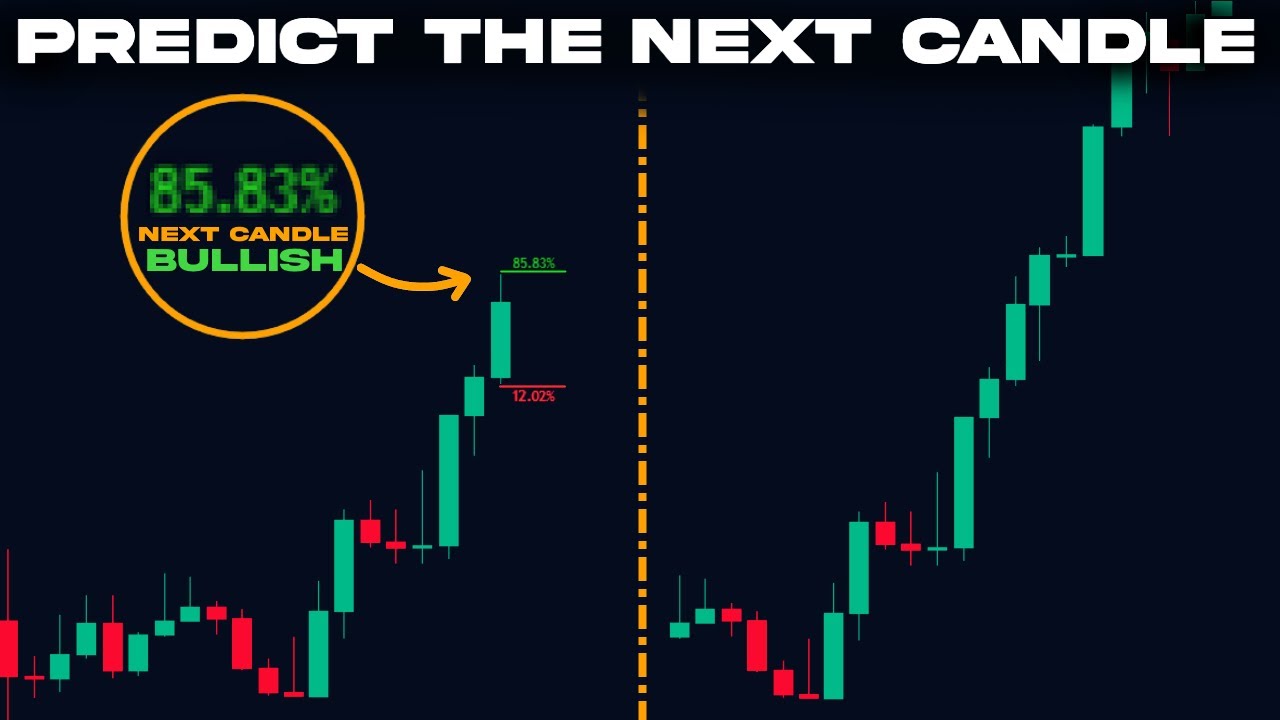
Learn how to use the Breakout Probability Indicator, a free and editor’s pick award-winning tool, to predict the next candlestick based on data analysis. This tool provides accurate percentages of the likelihood of a particular point in the price action being reached, allowing traders to make profitable trades. The video demonstrates three ways to use the indicator, including reading the percentage chance of a candlestick being bullish or bearish, utilizing the levels for the stop loss, and combining the indicator with other tools to create a strategy for entering a position.
Using the Breakout Probability Indicator to Make Profitable Trades
Introduction: Understanding the Importance of Candlestick Prediction
Adding the Breakout Probability Indicator to Your Chart
Understanding How the Breakout Probability Indicator Works
Analyzing the Indicator Settings and Inputs
Reading the Indicator: Basic and Advanced Methods
Using the Indicator for Entry, Stop Loss, and Take Profit Levels
Creating a Strategy with the Breakout Probability Indicator
Combining the Breakout Probability Indicator with Moving Averages
Step-by-Step Examples of Entering a Position with the Breakout Probability Indicator
Conclusion: Utilizing the Breakout Probability Indicator for Profitable Trading

