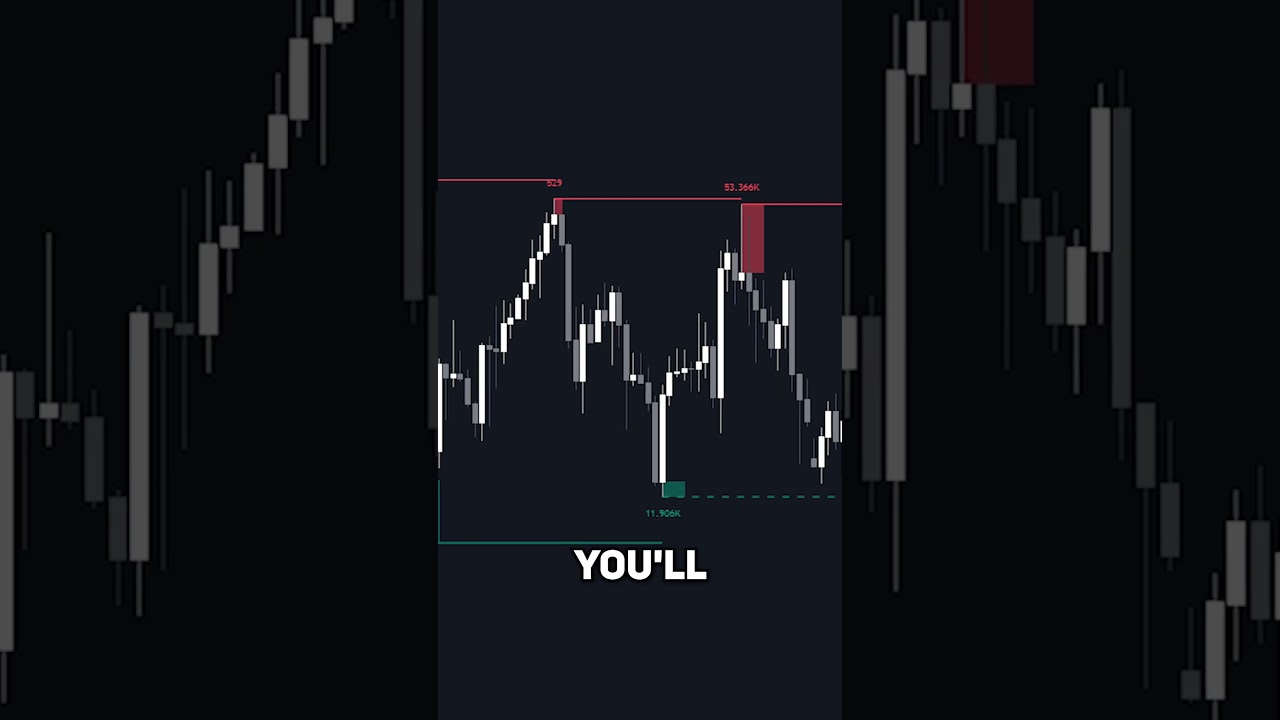
Learn how to improve your trading with the “Liquidity Swings” indicator available on Tradingview. With accurate swing points, you can identify accumulation and distribution zones based on actual liquidity. Pivot length setting should be 11 and intra-bar precision set to 5 minutes for best results. Use these levels to predict price movement and follow the volume data to determine the zones with the most liquidity.
A Game-Changing Free Indicator for Trading with Support and Resistance Zones
If you’re a trader who is passionate about the technical analysis of the markets, then you’re always looking for ways to make your trades more profitable. One popular trading strategy is using support and resistance zones. These zones are areas on a chart where the price of an asset has historically shown a tendency to either reverse or consolidate.
However, identifying these zones can be tricky, and it’s also difficult to determine the strength of each zone. That’s where the Liquidity Swings indicator by Lux algo comes in. This free indicator can be a game-changer for traders who want to trade with support and resistance zones.
What is the Liquidity Swings Indicator?
The Liquidity Swings indicator is a trading tool that helps you identify support and resistance zones with ease. It works by detecting the actual liquidity found at each swing point. This makes it easy to trade accumulation and distribution zones because you can use these levels and zones to see where price is likely to go.
Liquidity is a term often used in financial markets to describe the degree to which an asset can be bought or sold without affecting the asset’s price. In other words, if there’s a high volume of buyers and sellers in the market at a particular price point, then that price point has a high level of liquidity.
The Liquidity Swings indicator detects the liquidity at each swing point in a price chart, giving traders a clear picture of the most significant levels and zones in the market. This data can then be used to make better trading decisions.
How to Use the Liquidity Swings Indicator
Using the Liquidity Swings indicator is easy. Here’s how to do it:
1. Go to TradingView and type in “Liquidity Swings” in the search box.
2. Find the Liquidity Swings indicator by Lux algo and click on it.
3. In the indicator settings, change the Pivot Lookback Length to “11” and Intra Bar Precision to “5 Minutes”.
4. Once you’ve made these changes, you’ll see the swing points on your chart.
5. Use these swing points to identify support and resistance zones. You can also use the volume data at each swing point to determine which zone has the most liquidity.
6. Use this information to inform your trading decisions.
Benefits of Using the Liquidity Swings Indicator
There are several benefits to using the Liquidity Swings indicator:
1. Accurate Swing Points – The Liquidity Swings indicator gives you perfectly accurate swing points, making it easier to identify support and resistance zones.
2. Easy to Use – The indicator is easy to set up and use, even for novice traders.
3. High Liquidity Zones – The indicator helps you identify areas where there is high liquidity, making it easier to enter and exit trades.
4. Better Trading Decisions – With the Liquidity Swings indicator, you’ll have access to more accurate data, which can help you make better trading decisions.
Conclusion
The Liquidity Swings indicator is a powerful tool for traders who want to trade with support and resistance zones. It identifies the most significant levels and zones in the market based on the actual liquidity at each swing point.
By using this indicator, traders can make more accurate predictions about where price is likely to go and which zones have the most liquidity. This, in turn, can lead to better trading decisions and more profitable trades.
If you’re a trader who is serious about technical analysis, then the Liquidity Swings indicator is a tool that you don’t want to miss. Try it out for yourself today and see how it can change the way you trade.

