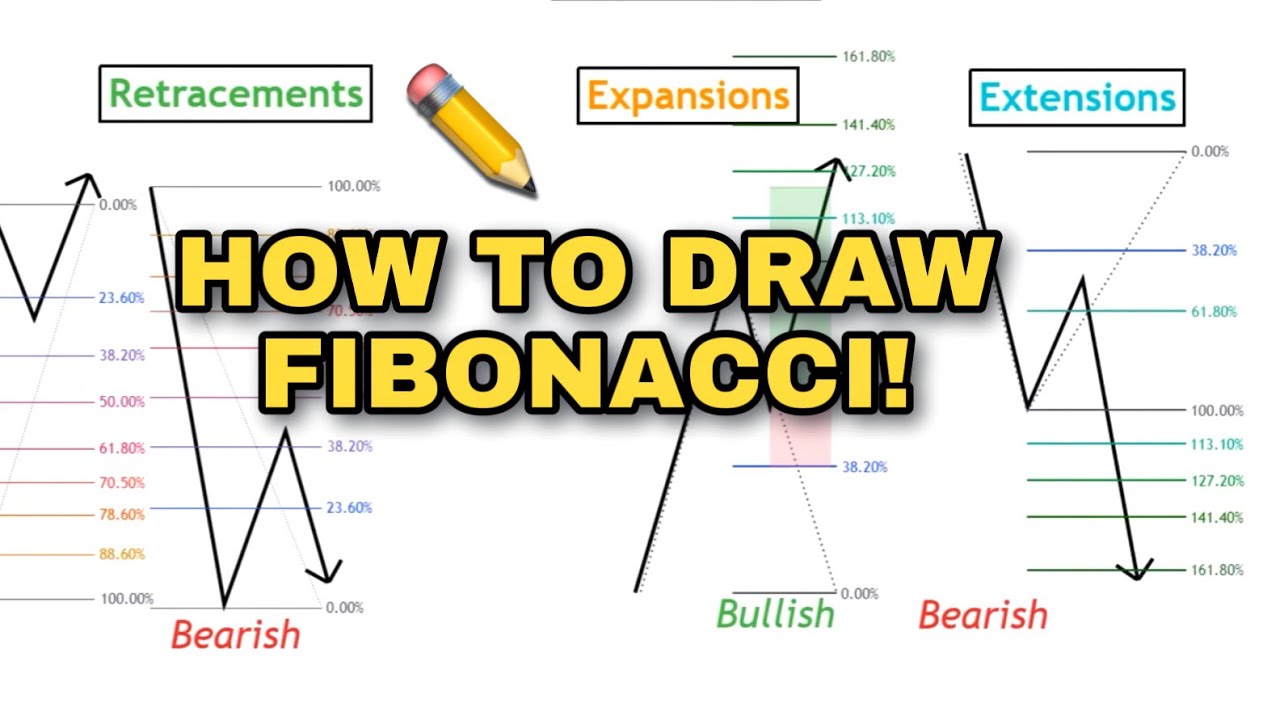
This video covers how to draw Fibonacci levels for trading, including retracements, expansions, and extensions. It is used to measure the corrective wave and potential levels for a continuation in the direction of the trend. Traders often use Fibonacci levels for entries and stop losses based on personal preferences and trading strategies.
Drawing Fibonacci for Trading: A Comprehensive Guide
Introduction
– Overview of the video content
– Importance of subscribing and liking the video
Fibonacci Retracements
– Definition of retracements and their relationship with the main trend
– Understanding bullish and bearish impulsive moves
– Determining the starting point for drawing Fibonacci retracements
– Importance of having Fibonacci levels on or off
– Strategizing entry and stop-loss points based on retracement levels
– Difference between retracements in a strong trend and retracements in a slowing trend
Measuring Bearish Impulsive Waves
– Starting points for measuring the bearish impulsive wave
– Moving the Fibonacci retracement tool to the right for better visualization
– Identifying the level of retracement and strategizing based on it
Fibonacci Expansions
– Differences between Fibonacci expansions and retracements
– Importance of having a strong belief in the trend direction before using expansions
– Starting points for measuring bullish and bearish impulsive waves
– Calculating potential Fibonacci levels for future price movements
Fibonacci Extensions
– Understanding the difference between Fibonacci extensions and expansions
– Identifying the levels for Fibonacci extensions
– Strategizing entry and stop-loss points based on extension levels
Conclusion
– Summary of the video content
– Importance of combining Fibonacci with other trading strategies
– Reminder to subscribe and like the video.

