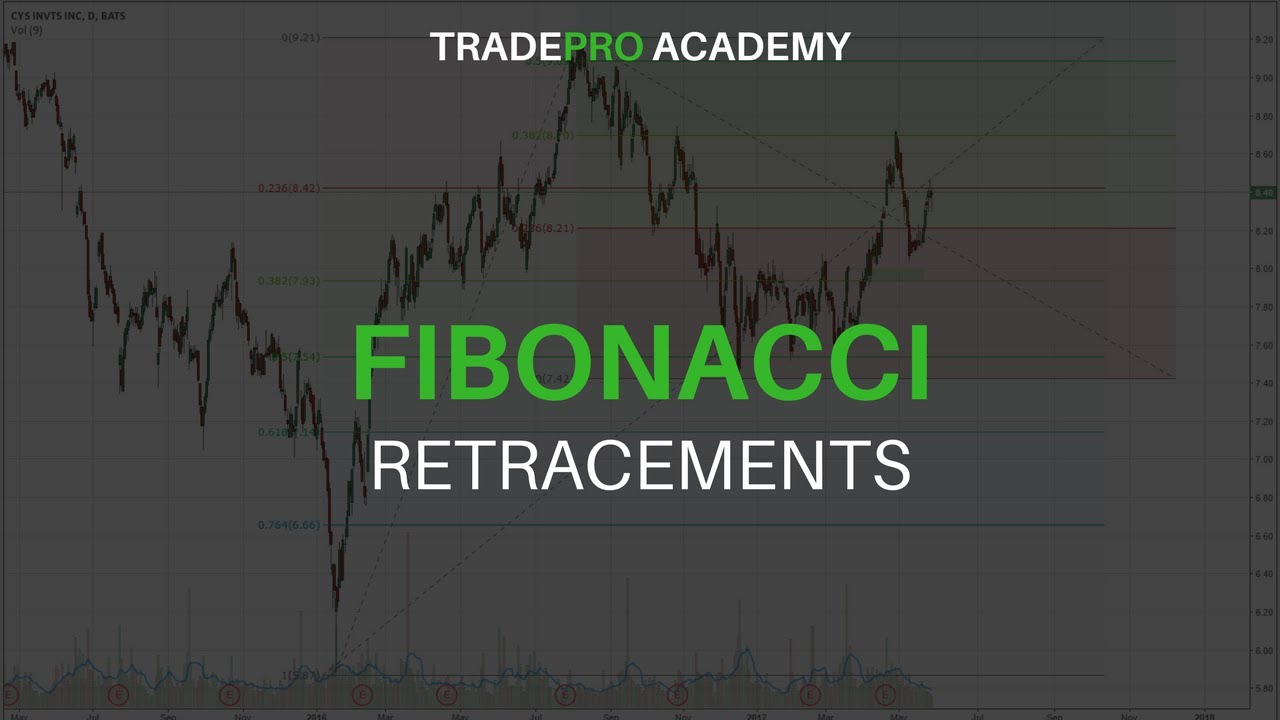
Learn how to use Fibonacci on Trading View, a free charting platform with some limitations, along with other tools. Fibonacci levels can help identify supports and resistance. Confluence of Fibonacci levels is important in trading. Sign up for Trade Pro Tips to learn more.
Using Fibonacci on TradingView – An Expert Guide
Introduction
TradingView is a popular charting platform that offers traders a range of tools and features, including the ability to draw Fibonacci retracements, extensions, and timezones. In this article, we’ll take a closer look at how to use these tools on TradingView to enhance your trading performance and gain a better understanding of market trends.
Getting Started with Fibonacci
To use Fibonacci retracements on TradingView, you first need to select the tool from the toolbar. Once you have selected the tool, you need to zoom out to the timeframe you want to analyze and select the low point of an upward trend to the high point. This will generate a range of Fibonacci numbers, which indicate the percentage retracements and dollar levels.
Understanding Fibonacci Levels
There are a range of Fibonacci levels that are important for traders to understand, including:
– 23.6%
– 38.2%
– 50%
– 61.8%
– 76.4%
– 88.4%
The 38.2%, 50%, and 61.8% levels are considered the most useful Fibonacci support levels, as they indicate where the price is likely to find support as it drops. Traders can use these levels to identify potential entry points for trading.
Using Confluence with Fibonacci
One of the most important concepts for traders to understand when using Fibonacci on TradingView is confluence. Confluence is when multiple levels coincide with one another, indicating a stronger level of support or resistance.
To identify confluence with Fibonacci, you need to draw multiple retracement levels from different points in the price chart. By doing this, you can see where the levels overlap and identify areas where there is confluence.
Using Fibonacci Extensions and Timezones
In addition to using Fibonacci retracements, traders can also use Fibonacci extensions and timezones on TradingView to identify potential price targets and predict market trends. Fibonacci extensions are used to identify potential resistance levels, while timezones can be used to predict when price movements are likely to occur.
Final Thoughts
In conclusion, Fibonacci is a powerful tool that traders can use to enhance their trading performance and gain a better understanding of market trends. By using Fibonacci retracements, extensions, and timezones on TradingView, traders can identify potential entry and exit points, as well as predict future price movements based on historical data. For optimal results, we recommend signing up for the Trading Foundations course on TradePro Academy, which covers everything you need to know about using Fibonacci in your trading strategy.

