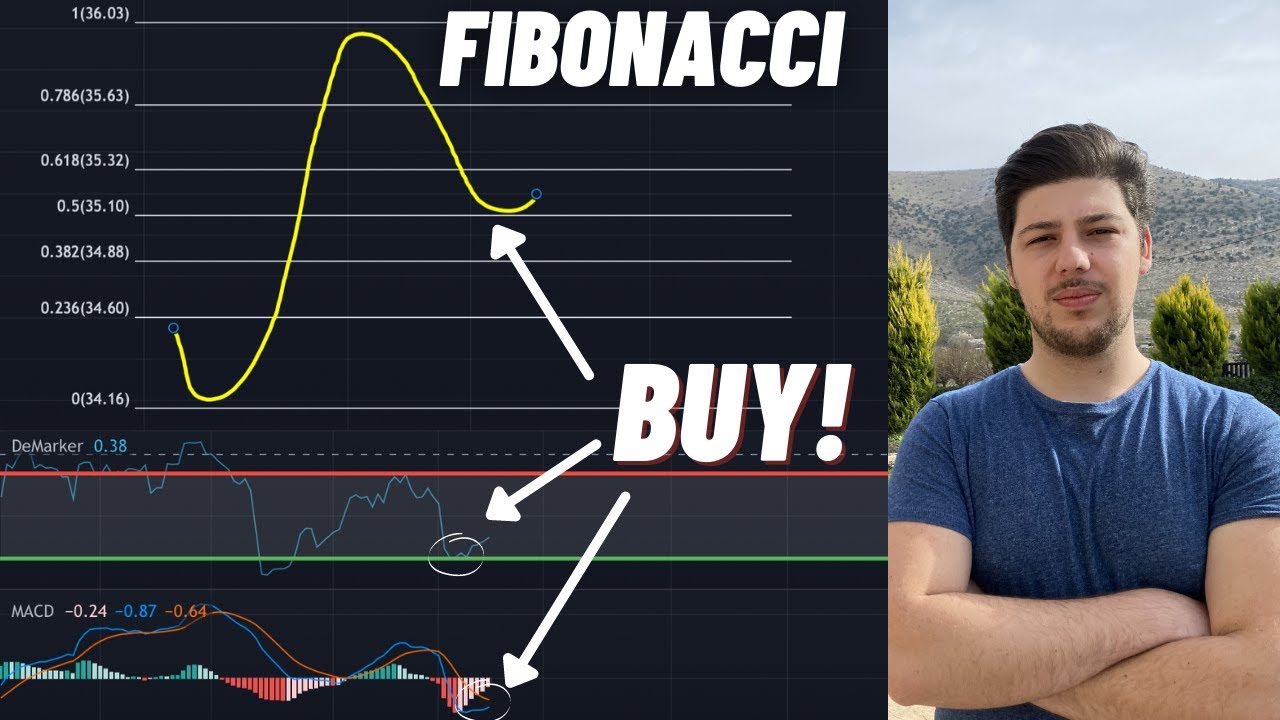
Fibonacci retracement detects pullback or bounce back levels in stocks using percentage lines. Applied during uptrend or downtrend, it should be paired with other indicators to increase trading success.
Using Fibonacci Retracement as a Trading Tool: Understanding the Basics
Fibonacci retracement is a trading tool used to detect pullback or bounce-back levels for a stock that is either on an uptrend or downtrend. Before understanding the percentages involved in Fibonacci retracement, we need to understand Fibonacci, the mathematician who created a sequence where each number represents the sum of the two preceding ones.
Calculating Fibonacci Retracement Levels
To calculate the percentage levels for Fibonacci retracement, take a number and divide it by the one next to it. For example, if you take the number 5 and divide it by the number next to it (8), you will get the 0.618 level. Additionally, if you take a number and divide it by the second number next to it (13), you will get the 0.38 level. Similarly, if you take a number and divide it by the third number next to it (21), you will get the 0.23 level.
Fibonacci Retracement Levels in Uptrend and Downtrend
To draw the Fibonacci retracement line for a stock that is on uptrend, the trader should find swing lows and swing highs, and then start drawing the retracement lines using the Fibonacci retracement tool. This tool will then detect the pullback or bounce-back levels.
On the other hand, for a downtrend, the trader should deduct the swing highs and swing lows and draw the Fibonacci retracement line accordingly.
The Importance of Combining Fibonacci Retracement with Other Trading Indicators
When using the Fibonacci retracement tool, it is essential to combine it with other trading indicators to increase the probability of success in your trading strategies. A stock may reverse from any level, so it should not be used alone.
Using Fibonacci Retracement for Improved Trading Strategies
A good example of using the Fibonacci retracement tool is with the stock Hog Harley Davidson. By using the Fibonacci retracement indicator, the trader found the swing low and swing high levels, which helped identify the pullback level. Other trading indicators, such as the market indicator, oversold state of the stochastic RSI, and low channel, were used to increase the probability of success in the trading strategy.
In summary, the Fibonacci retracement tool is a powerful tool that traders can use to detect pullback or bounce-back levels for a stock that is either on an uptrend or downtrend. By combining it with other trading indicators, such as the market indicator, stochastic RSI, MACD, and low channel, traders can significantly increase their probability of success in their trading strategies. Fibonacci retracements should not be used as the main tool, but rather as a supplementary tool to improve the probability of success.

