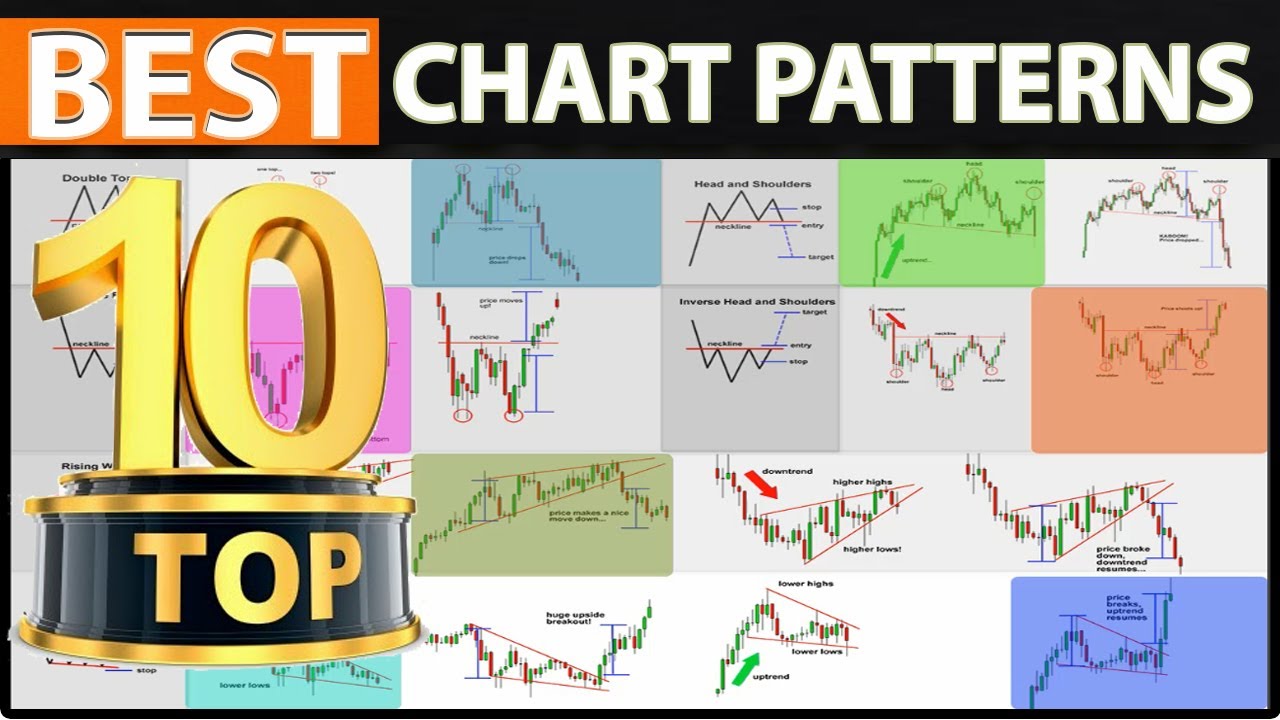
This video discusses profitable chart pattern trading strategies that can be used for currency trading, stock trading, and crypto. It explains the three types of chart patterns, which are continuation patterns, reversal patterns, and bilateral patterns, and provides examples of each. The video also emphasizes that chart patterns are not a guarantee of future price movement and advises viewers to be careful and place stops when trading. Finally, it covers 10 specific chart patterns that every trader should learn, such as double top, double bottom, head and shoulders, triple top, triple bottom, and cup and handle.
Simple yet Profitable Chart Patterns Trading Strategies: A Guide to Technical Analysis
Introduction: Understanding Chart Patterns
– Explanation of chart patterns and their importance in technical analysis
– Broad categories of chart patterns: Continuation, Reversal, and Bilateral Patterns
– Importance of knowing what to look for in chart patterns and using them effectively
– Applicability of chart patterns to different asset types: currency, stocks, and crypto
10 Chart Patterns Every Trader Should Learn:
1) Double Top
– Explanation of double top as a reversal pattern after an extended move up
– Peak formation and bouncing off a certain level indicating a buying pressure decline
– Anticipating a reversal and placing an entry order below the neckline
– Placing the stop loss above the second peak
2) Double Bottom
– Explanation of double bottom as a trend reversal formation after extended downtrends
– Two valleys or bottoms being formed and the second bottom not significantly breaking the first bottom
– Anticipating a reversal and placing an entry order above the neckline
– Placing the stop loss below the second valley
3) Head and Shoulders
– Explanation of head and shoulders chart pattern with a baseline and three peaks, the middle one being the highest
– Predicting a bullish to bearish trend reversal
– Waiting for the pattern to complete and entry after a break of the neckline
– Placing the stop above or below the right shoulder
4) Triple Top
– Explanation of triple top as a reversal in the movement of an asset’s price consisting of three peaks
– Signal of the asset no longer rallying and indicates lower prices may be on the way
– Entry point after the price break out from the support level or neckline
– Placing the stop loss at the third top of the pattern
5) Triple Bottom
– Explanation of triple bottom as a bullish chart pattern characterized by three equal lows
– Opportunity to enter a bullish position after the price action breaches resistance
– Entry point after the price break out from the resistance level or neckline
– Placing the stop loss at the third bottom of the pattern
6) Cup and Handle
– Explanation of cup and handle pattern where cup is formed from a declining trend and handle is formed from a short-term consolidation
– The break of the resistance line as a trigger point for a trend reversal and bullish entry point
– Placing the stop loss below the handle’s low
7) Falling Wedge
– Explanation of falling wedge as a bullish chart pattern formed from decreasing highs and lows
– Interpretation of wedge shape as an indication of resolving in a bullish breakout
– Placing entry orders after the breakout of the resistance line
– Placing the stop loss below the previous low
8) Rising Wedge
– Explanation of rising wedge as a bearish chart pattern formed from increasing highs and lows
– Interpretation of wedge shape as an indication of resolving in a bearish breakout
– Placing entry orders after the breakout of the support line
– Placing the stop loss above the previous high
9) Flag and Pennant
– Explanation of flag and pennant patterns as a consolidation after a significant price spike
– Interpretation of the pattern as a short-term continuation of the previous price movement
– Entry point after price action breaks out of the pattern
– Placing the stop loss below the bottom of the flag or pennant
10) Symmetrical Triangle
– Explanation of symmetrical triangle as a common chart pattern formed from decreasing highs and increasing lows
– Interpretation of the pattern as a sign of price consolidation
– Entry orders placed after the price breaks out of the pattern
– Placing the stop loss below the lowest low of the pattern
Conclusion: Chart Patterns Are Indications, Not Guarantees
– Emphasis on understanding that chart patterns suggest potential movement, but are not guarantees
– Importance of combining chart patterns with market analysis
– Reminder to place stops and consider positions with contract for difference or cfds

