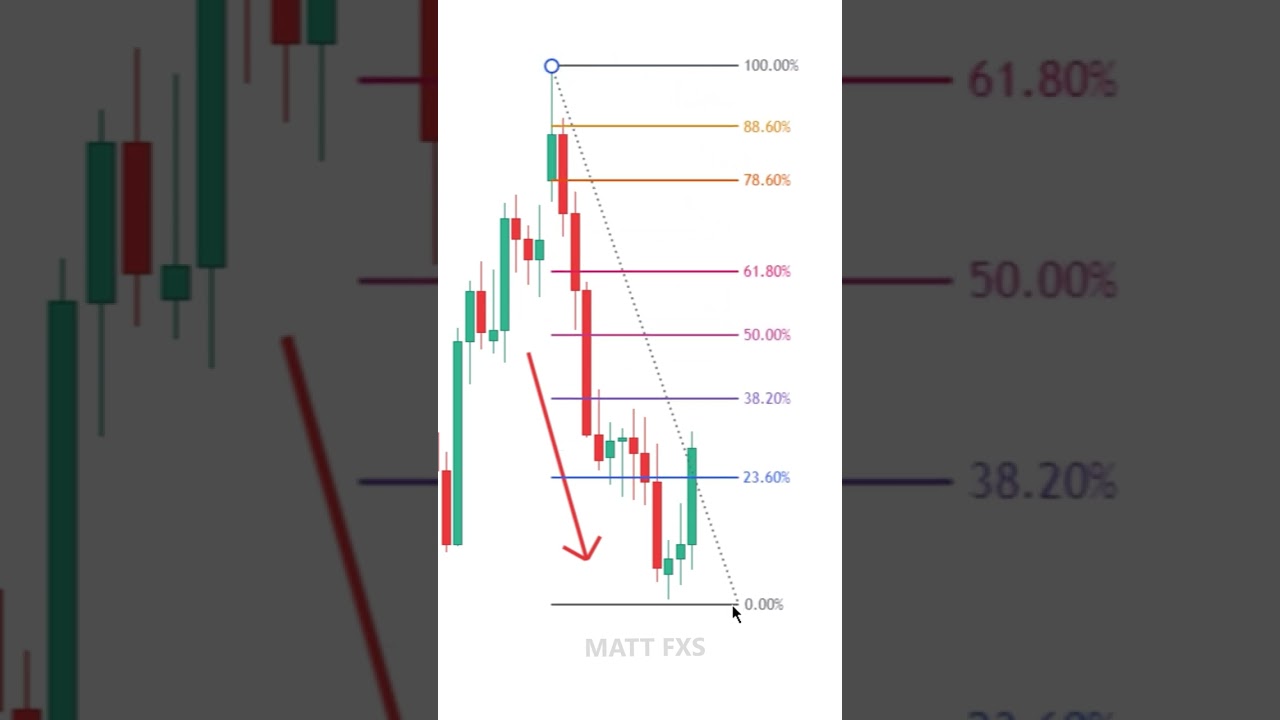
Learn how to use Fibonacci retracement tool as a trader by connecting first point to low/high and second point to high/low. These levels can act as support/resistance and better trade entries. Different levels are tested depending on the trend type and some traders prefer 61.8 as it represents the golden mean ratio in Fibonacci.
How to Draw Fibonacci Levels as a Trader for Better Trading Decisions
As a trader, you constantly seek ways to analyze the market and identify key areas of support and resistance. One such approach is using Fibonacci levels, which can help you make better trading decisions. In this article, we will explore how to draw Fibonacci levels and analyze them for better insights.
Drawing Fibonacci Levels: The Basics
– Identify a Bullish or Bearish Impulsive Move
Before drawing Fibonacci levels, you need to identify a bullish or bearish impulsive move. This is a section of the chart where the price moves in a particular direction in a fast and strong manner. The impulsive move is the section of the chart where the price moves in a defined direction with a strong momentum.
– Select the Fibonacci Retracement Tool
Once you have identified the impulsive move, you need to select the Fibonacci retracement tool. This tool is available in all trading platforms and can be accessed easily.
– Draw the Fibonacci Levels
For a Bullish Impulsive Move: To draw Fibonacci levels for a bullish impulsive move, you need to connect the first point to the low and then the second point to the high. Then, extend the line to the right. This will create the Fibonacci retracement levels for the bullish impulsive move.
For a Bearish Impulsive Move: To draw Fibonacci levels for a bearish impulsive move, you need to connect the first point to the high and then the second point to the low. Then, extend the line to the right. This will create the Fibonacci retracement levels for the bearish impulsive move.
Analyzing Fibonacci Levels: What They Mean
– Support and Resistance Zones
When the price retraces, some of these Fibonacci levels could act as many zones of support and resistance. Whenever you see price bounce off a Fibonacci level, it means that the particular level is acting as a support or resistance level.
– Trading Entries
Fibonacci levels can be used as better trade entries. Within a trend or even as take profit levels if it’s a counter trend trade. The reason is that Fibonacci retracement levels act as support or resistance levels, so when the price bounces off a level, there is a high probability that the price will continue to move in the direction of the trend.
– Which Levels are More Likely to be Tested?
If these are drawn in a strong trend, then a 23.6, 38.2, or 50 retracement levels are more likely to be tested. If these are drawn in a slower trend like a channel or a ranging market, then the 61.8, 78.6, or 88.6 levels are more likely to be tested. The reason is that in a stronger trend the retracements will not be as deep, whereas in a slower trend the retracements will be deeper.
– The Golden Mean Ratio
For some technical traders, the 61.8 level is the most popular as it represents the golden mean ratio in Fibonacci. It is believed that this level is significant because it reflects the ratio of growth in natural systems such as the spiral of a nautilus shell or the pattern of leaves on a stem.
Conclusion
Drawing Fibonacci retracements is a great way to identify key areas of support and resistance in the market. By drawing these levels correctly, you can make better trading decisions and improve your trading results. Remember that Fibonacci retracement levels are just one tool in your arsenal, and it should be used in conjunction with other technical analysis tools to form a holistic trading strategy. We hope this article has provided some insights on how to draw Fibonacci levels and analyze them for better trading decisions.

