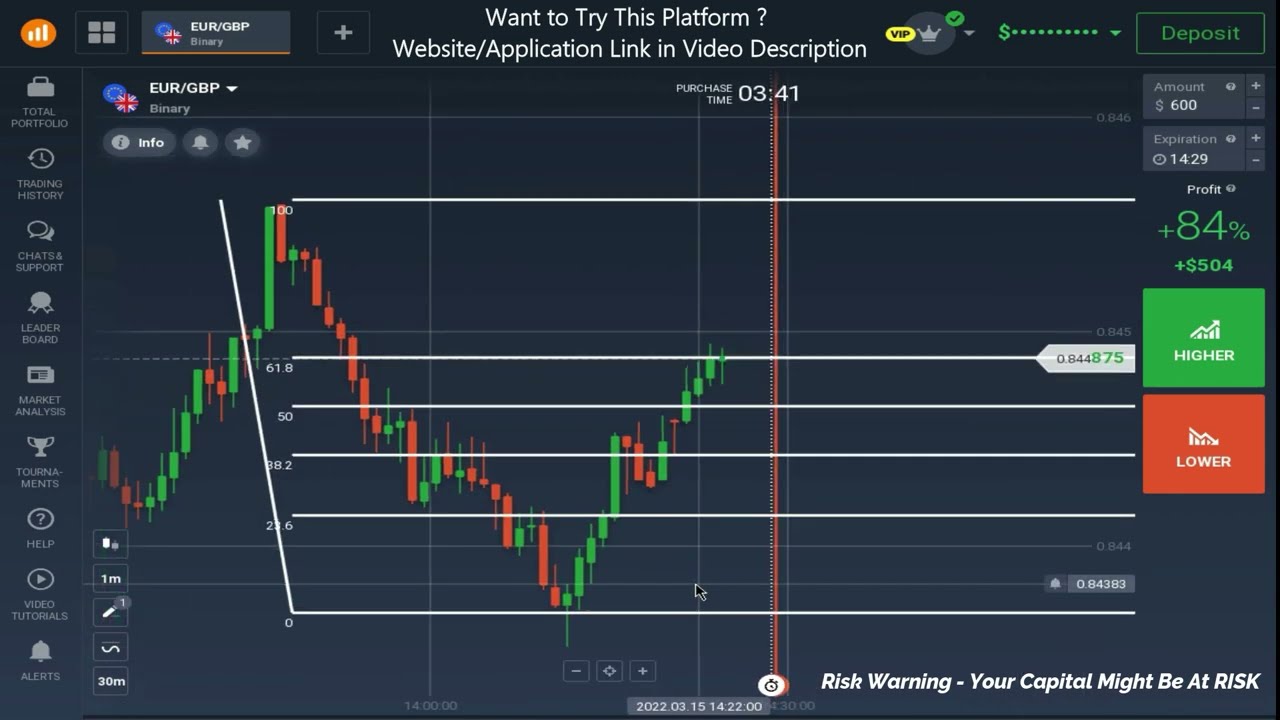
A trader discusses the strategy of trading over a five minute time frame using one-minute candlestick charts. The strategy involves analyzing support and resistance levels and identifying strong levels to place trades in the direction of the minor trend. The trader explains each step of the setup and how to identify weak market movements. Ultimately, the trader takes a winning trade based on price action, fibo level, and candlestick reversal pattern.
5-Minute Time Frame Trading Strategy: Explained and Applied
Introduction
In this article, we will explore a trading strategy for the 5-minute time frame that is based on candlestick analysis. This strategy relies on identifying market trends and using critical levels of resistance and support to take trades. We will explain this strategy in detail and provide a step-by-step guide to help traders apply it in their trading.
Identifying Market Trends
As a trader, it’s crucial to identify market trends to make profitable trades. In the video, the presenter analyses a 1-minute candlestick chart to identify market trends. He notes that previously, the market was moving in an uptrend, but now the price action shows signs that it may fall. He identifies this by comparing the current chart with the previous swings in the market. By comparing the swings in the market, he identifies a lower low swing which implies that the market will fall.
Using Resistance Levels for Trades
The presenter then identifies a resistance level, which he uses to place trades. The market is restricted by a resistance level that is clear from the previous chart. The presenter uses this resistance level to place trades, taking advantage of the retraction of the market before it continues on a downtrend. He correctly predicts that the market will retrace or fall again in the future. This becomes his basis for taking trades.
Waiting for Weakness in the Market
However, the presenter notes that for the set up to be complete, they need weak confirmation that the market wants to fall. He identifies previous swings in the market, but these were not strong enough to substantiate the set up. As such, he waits for the market to get weak, or for a strong level to show up, or for candlestick confirmation, all of which would confirm that the market now wants to fall.
Taking Trades
After waiting, the presenter identifies a level of resistance that is favourable, represented by the Fibonacci retracement level of 61.8 or a golden level. The market respects this level, forming a reversal pattern, which is proof that the level is strong, and it’s a good place to take short trades. He waits for the next candlestick, which breaks the level, and that’s when he executes the trade.
The Results
In the video, the presenter executes a trade based on this set up and wins the trade easily. He explains how to interpret the results, the market trends, and the importance of identifying a strong resistance level before taking trades. The presenter also highlights that trading in the direction of the minor trend, in this case, a downtrend, is crucial to maximising profits.
Conclusions
In conclusion, the 5-minute time frame trading strategy based on candlestick analysis involves identifying market trends, using resistance levels and waiting for weak market confirmation. It’s important to focus on the swings in the market and identify strong levels of resistance for successful trades. By following the outlined steps, traders can apply this strategy to earn profits in their trades.

