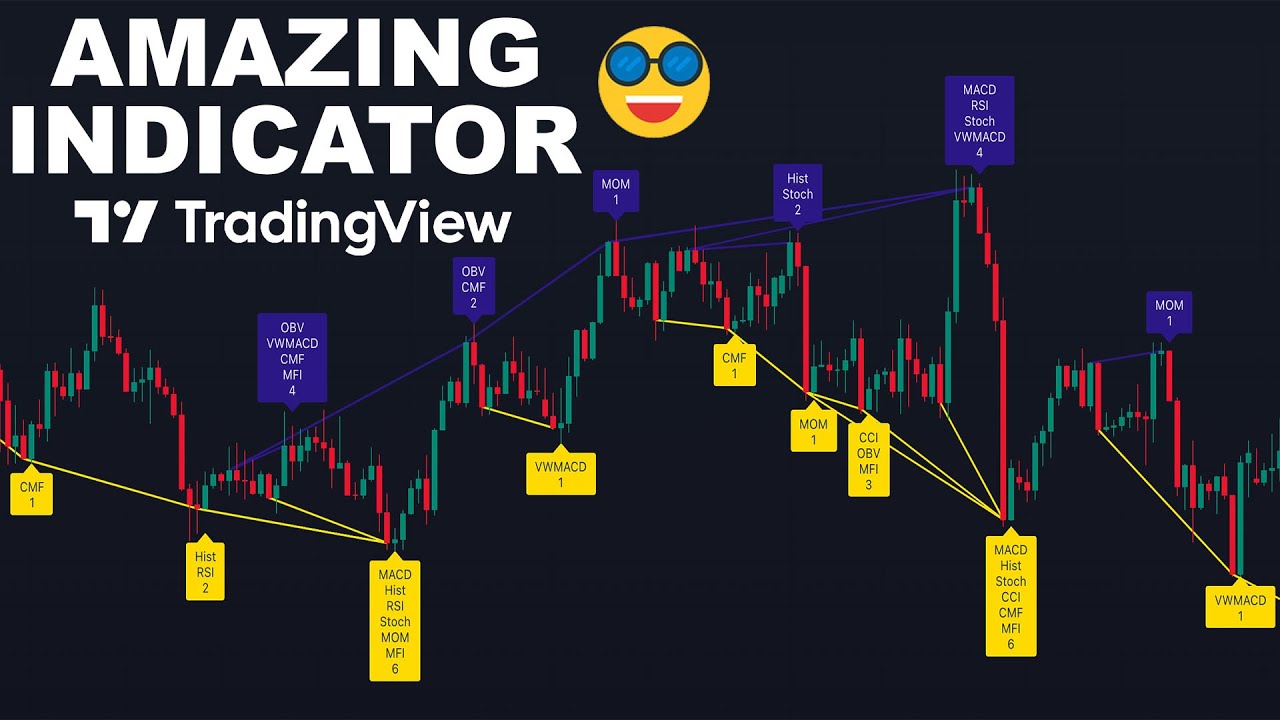
Learn how to use trading indicators to identify divergences, which indicate a trend is weakening and a reversal may happen, using the Divergence indicator on TradingView. The indicator shows all divergences based on a list of indicators and can be used alongside other tools and concepts in technical analysis for more confirmation of trading signals. However, only using divergences as a trading signal may not always be correct, and must be used in conjunction with other factors.
Using the Divergence Indicator on TradingView: An Essential Tool for Technical Analysis
Introduction: The Importance of Divergence in Technical Analysis
Divergence is one of the most critical concepts when it comes to technical analysis in trading. It helps traders to identify possible weakening in a trend and a potential reversal. Divergence is discovered through indicators or oscillators that we add to our chart. In this article, we will explain what divergence is and demonstrate how to use the Divergence Indicator on the TradingView platform.
Bullish and Bearish Divergence: An Example
To provide an example of bullish and bearish divergence, we can use the RSI (Relative Strength Index) and MACD (Moving Average Convergence Divergence) indicators. Bullish Divergence forms when the price makes a lower low, but the oscillator makes a higher low. This signals a decrease in downside momentum and an increase in upside momentum, indicating that a reversal may occur.
On the other hand, Bearish Divergence occurs when the price makes a higher high, but the oscillator makes a lower high. This shows that upside momentum is losing strength, while downside momentum is gaining strength, indicating that an end to the price’s advance is possible.
Using the Divergence Indicator on TradingView
The Divergence Indicator on TradingView is an essential tool for traders because it shows all the divergences that form on the chart based on a list of indicators. The indicator can find divergences based on many indicators such as MACD, RSI, Stochastic, CCI, Momentum, OBV (On Balance Volume), Volume-Weighted MACD, Trix, and Money Flow.
By accessing the indicator’s settings, you can select which indicator(s) to use to find the divergences. The indicator will then show the divergences by the help of a line indicating price movement. On the line, you can see a text box showing either “Bearish Divergence” or “Bullish Divergence.” When the line is upward showing “higher high,” it indicates a bearish divergence. Conversely, when the line is downward showing “lower low,” there is a bullish divergence.
Using the Divergence Indicator with Your Trading Strategy
While the Divergence Indicator is a valuable tool in evaluating trends and finding out if they are weakening, it should never be used alone. You should always use this indicator alongside your trading strategy and in conjunction with other tools and concepts of technical analysis. More so, if you get three to five indicators showing a divergence, it’s an excellent opportunity for more probability in your analysis that the price will likely turn and advance. However, you need more confirmations for your trading decisions to ensure you don’t make a wrong move.
Conclusion: The Importance of Technical Analysis in Trading
In conclusion, technical analysis plays a significant role in trading, and divergence is one of the most important concepts. The Divergence Indicator on TradingView is a valuable tool for traders who want to make informed decisions for their trading strategy. But remember, never trade solely based on the Divergence Indicator, as it needs to be used in conjunction with other tools and strategies. Stay mindful, and good luck with your trading!

