Technical Analysis 101: A Comprehensive Guide to Trading
If you are interested in trading, then technical analysis should be at the forefront of your mind. This is the study of historical price movements in order to make more accurate decisions about what the market may do next. It is this ability to make good trading decisions that can lead to making a profit in any market. In the absence of technical analysis, traders not only lose money, but also struggle to create profits over time.
Therefore, in this article, we shall explore everything you need to know about technical analysis: from candlestick charts to indicators, support, and resistance levels, as well as trends entry patterns, and how to reduce trading risks by setting stop-loss orders and taking profits.
What is Technical Analysis?
At its core, technical analysis is an investment strategy that involves identifying historical price trends and current levels of market volatility in order to predict future price movements. Every part of technical analysis is based around price. It is the foundation upon which technical analysis is built.
The Candlestick Chart
The very first thing to learn about technical analysis is the candlestick chart. If you want to trade in any market, whether forex, stocks, or crypto, you need to grasp this important concept.
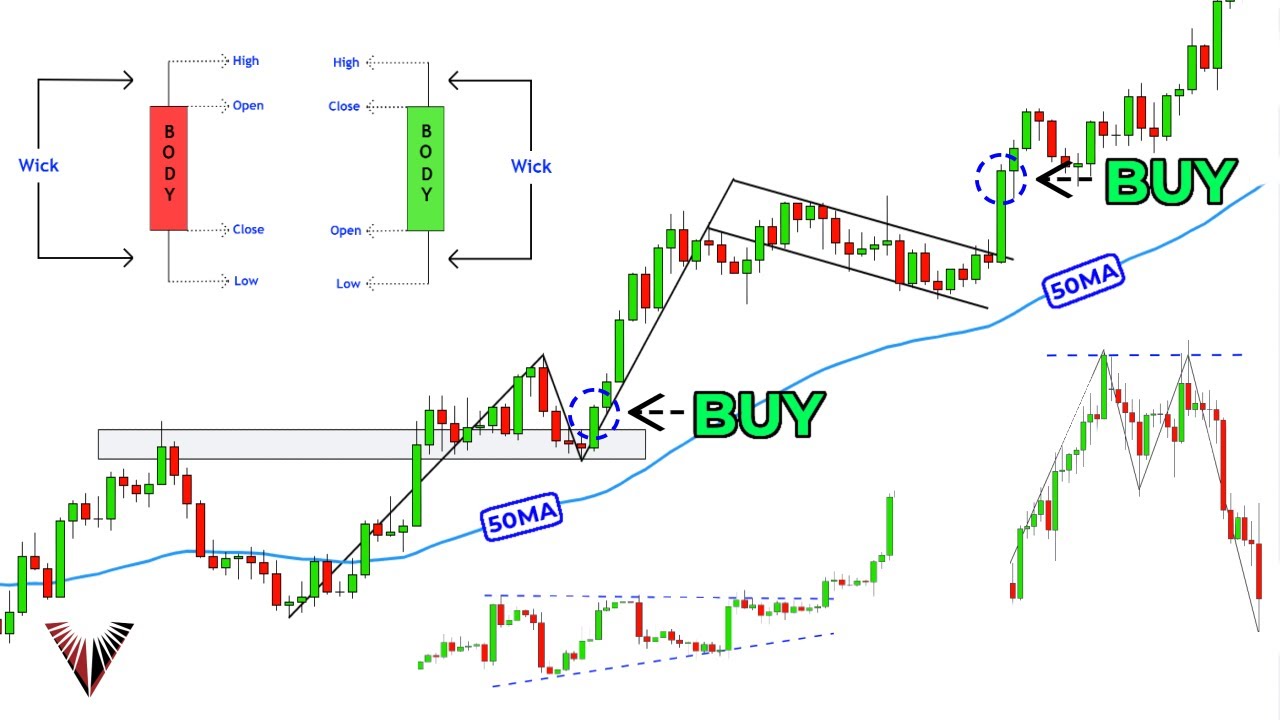
A candlestick chart is a visual representation of price movements over a specific period of time, which can range from minutes, hours, days, or months. The chart consists of a long vertical body and two wicks, which are lines extending from the body. Each candlestick is either green or red. A green candlestick, also known as a bullish candle, represents a period when price increased, while a red candlestick, also known as a bearish candle, represents a period when price decreased.
Every candlestick chart consists of four main components: the open, the high, the low, and the close. The open is where price first started trading during the period in question. The high is the highest point reached by price during that period. The low is the lowest point reached by price during that same period, while the close is the point at which price ended the period in question.
Trend
Another important aspect of technical analysis is trend analysis. A trend is when prices in the market are consistently moving in one direction: either up or down. A trend line connects the highest highs or lowest lows of prices to show the upward or downward progression of price over time. It is formed by connecting a minimum of two lows or two highs. The goal of identifying a trend is to get an idea of where the market price might go next.
Support and Resistance
Support and resistance levels are important concepts to keep in mind while analyzing trends. A support level is a price at which a market tends to stop declining, whereas a resistance level is a price at which a market tends to stop climbing. These levels are formed by connecting the horizontal points at which the price shows significant changes in direction.
Indicators
Indicators are formulas that use past price data to indicate which direction the market is likely to move in next. They overlay the price chart to provide additional insights into market trends. The most common indicators include moving averages, oscillators, and trendlines. Indicators are not perfect, and relying entirely on them can be dangerous, but they are useful when used in conjunction with other analysis tools.
Entry Patterns
Entry patterns are specific price configurations that are believed to be good times to enter or exit a trade. Some of the most commonly used entry patterns include the engulfing pattern, pin bar, and the morning star. While no entry pattern is guaranteed to work all the time, they can be useful in giving traders a hint of what to expect.
Stop-loss and Take-profit
A stop-loss order is a protective measure where a trader sets a limit on the potential loss they can incur for a trade. This measure is set to contain the loss within an acceptable range. On the other hand, a take-profit order is a profit limit that traders set to close the trade at a particular price when they are happy with their profit.
Conclusion
Technical analysis is an essential tool for any trader who aspires to succeed in the market. It’s the study of patterns and price history that enables traders to make more accurate decisions about what the market might do next. Key concepts include candlestick charts, trends, support and resistance, indicators, entry patterns, stop-loss, and take-profit options. Ultimately, understanding technical analysis will help traders to make informed trades and reduce risks. By mastering these concepts, you too can become a successful trader.

