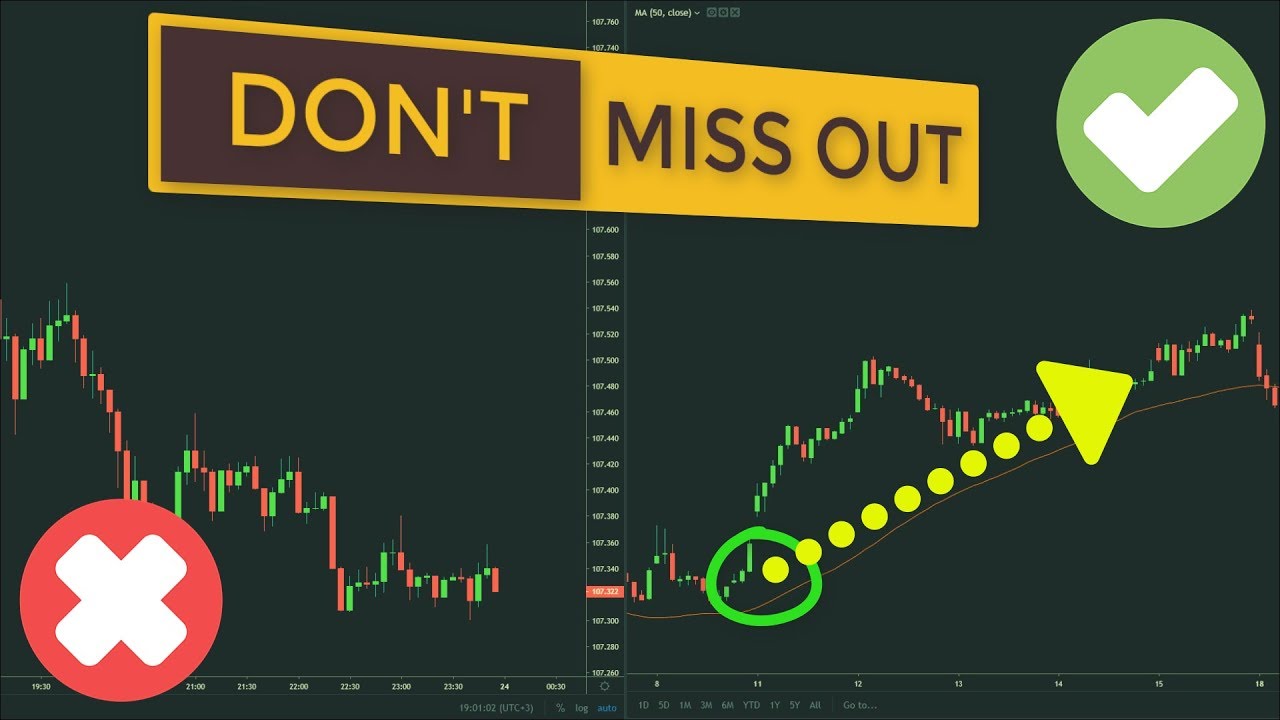
Learn 5 techniques to identify dominant trend for trading instruments including moving averages, pivot points, Kumo cloud of Ichimoku indicator, ADX line, and Keltner channel slope. These techniques help traders stay on the right side of the market and trade the strongest trends. Remember to look for as much evidence as possible to confirm a trade and avoid taking positions based on one factor alone.
5 Techniques to Identify the Dominant Trend in Trading Instruments
Introduction
For day traders, remaining on the right side of the market is crucial. Knowing the dominant trend in a trading instrument is a key component of successful trading. In this article, we will go over five techniques to identify dominant trends across stocks, currency pairs or CFDs.
Using the 200 EMA and 600 EMA
The first technique takes into account the 200 EMA and 600 EMA on the 5 min chart. The short-term trend is determined using the 200-period exponential moving average, while the medium-term trend is determined using the 600-period exponential moving average.
Comparing the Central Pivot Points
Pivot points are used by floor traders to determine directional movement and potential support/resistance levels. In order to identify the trend, one should focus on the central pivot point. The central pivot point represents the intraday point of balance between the buyers and sellers and is usually where the largest amount of trading volume takes place.
Using the Kumo Cloud of the Ichimoku Indicator
The Kumo cloud offers a unique perspective of support and resistance, representing these levels based on price action. Here, the longer the price stays below/above the Kumo cloud, the stronger the trend is.
Using the ADX Line on the 30-Min Chart
The ADX line is one of the most reliable indicators to anticipate the beginning of new trends or a continuation of the current ones. ADX measures trend strength and shows trend direction at the same time.
Slope of the Keltner Channel
The Keltner channel is a combination of an exponential moving average and the average true range indicator. Here, the Keltner channel’s slope is simply the direction of the channel plotted on the chart.
Conclusion
While trend analysis is only one part of the overall trading strategy, it is crucial in identifying the dominant trend of a trading instrument. Using any one of these five techniques, traders can make better decisions based on the current trend and ultimately increase their trading success.

