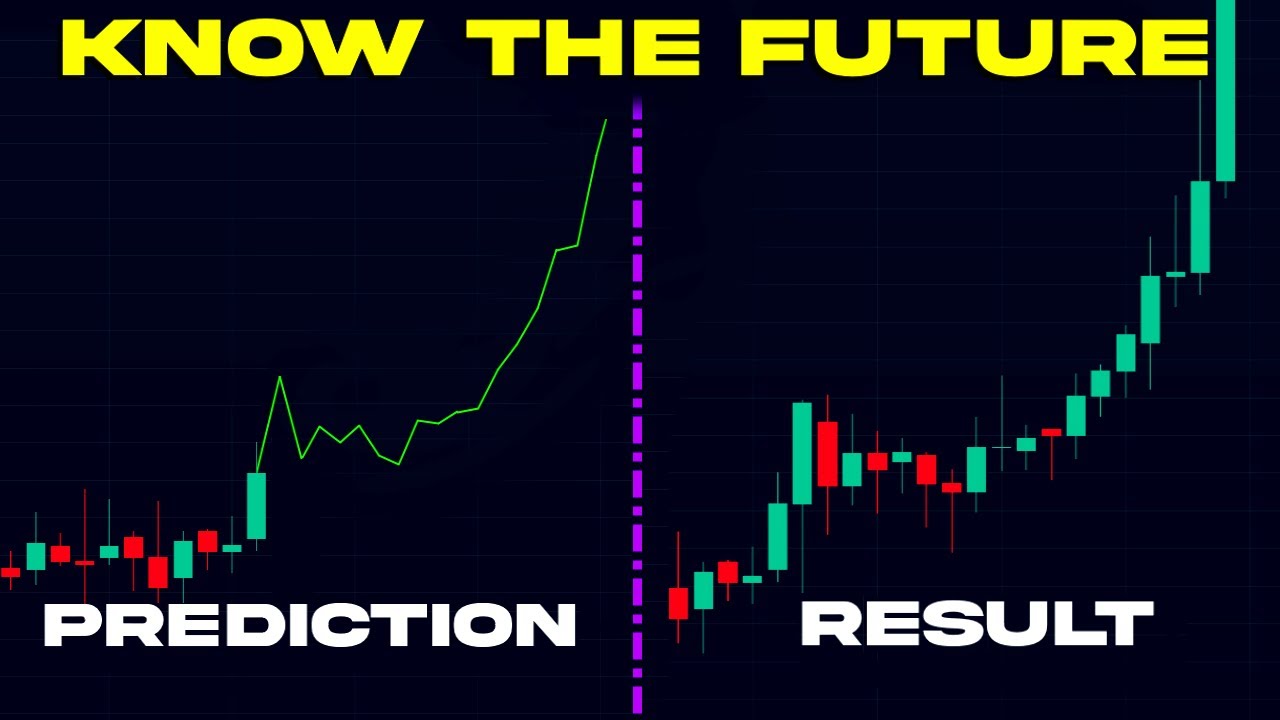
Learn about a new and free trading view indicator that predicts future price of assets accurately. The Echo Indicator is explained with its evaluation, forecast, and construction features. To make the strategy profitable, SSL Hybrid Indicator and Volume Oscillator are added. The indicators are tailored by changing the settings and colors to accentuate the signals. The trend direction is determined by SSL, Volume Oscillator helps filter out ranges and sideways market, and Echo forecast is used as an entry signal. To enter into a long position, the forecast line must point upwards, SSL indicator color blue, and volume line above the zero line. Before entering into the position, the trade is mapped out, and stop loss is put at the recent swing low targeting a 1.5 times risk-to-reward ratio.
Unlocking the Secret to Predicting Price Movement: Introduction to the Echo Indicator
In this article, we’ll be exploring an unusual yet relatively accurate indicator that predicts the future price of an asset by analyzing its price history. Stay tuned to discover this new and free indicator and how to use it to enter profitable positions.
Understanding How the Echo Indicator Works
Before we dive deeper into how to use the Echo Indicator, we’ll explore its settings, including the evaluation window, forecast window, forecast mode, forecast construction, and source.
How to Use the Indicator to Enter Profitable Positions
Let’s take a closer look at the three colors used in the Echo Indicator that show the forecasting window, the most similar historical price segment, and the evaluation zone, respectively. We’ll then illustrate how to use the indicator to forecast future trends and signal when to enter into buy or sell positions.
How to Enhance the Strategy with Additional Indicators
Although the Echo Indicator is relatively accurate, it’s not meant to be used independently. Therefore, we’ll show you how to reinforce your trading strategy by adding other indicators, including the SSL hybrid and volume oscillator indicators.
Optimizing the Indicator Settings
To optimize the use of these indicators, we’ll change their settings. For instance, we’ll adjust the Baseline length, Baseline type, and styling options for the SSL hybrid indicator and the line color for the volume oscillator indicator.
Combining the Indicators for More Accurate Predictions
Now that we’ve set up all the indicators, we’ll illustrate how to use them in tandem to predict where the price of an asset may be headed. We’ll use the trend direction (SSL hybrid) indicator to filter out trades, the volume oscillator indicator to exclude ranging and sideways markets, and the Echo Indicator as the entry signal.
When to Enter into a Position
Finally, we’ll outline a set of conditions that must be fulfilled before you can enter into a long position, including analyzing the forecasting line, SSL hybrid candlestick color, and volume oscillator line. We’ll also show you how to map out the entry, place a stop loss at the recent swing low, and target a 1.5 times risk-to-reward ratio.

