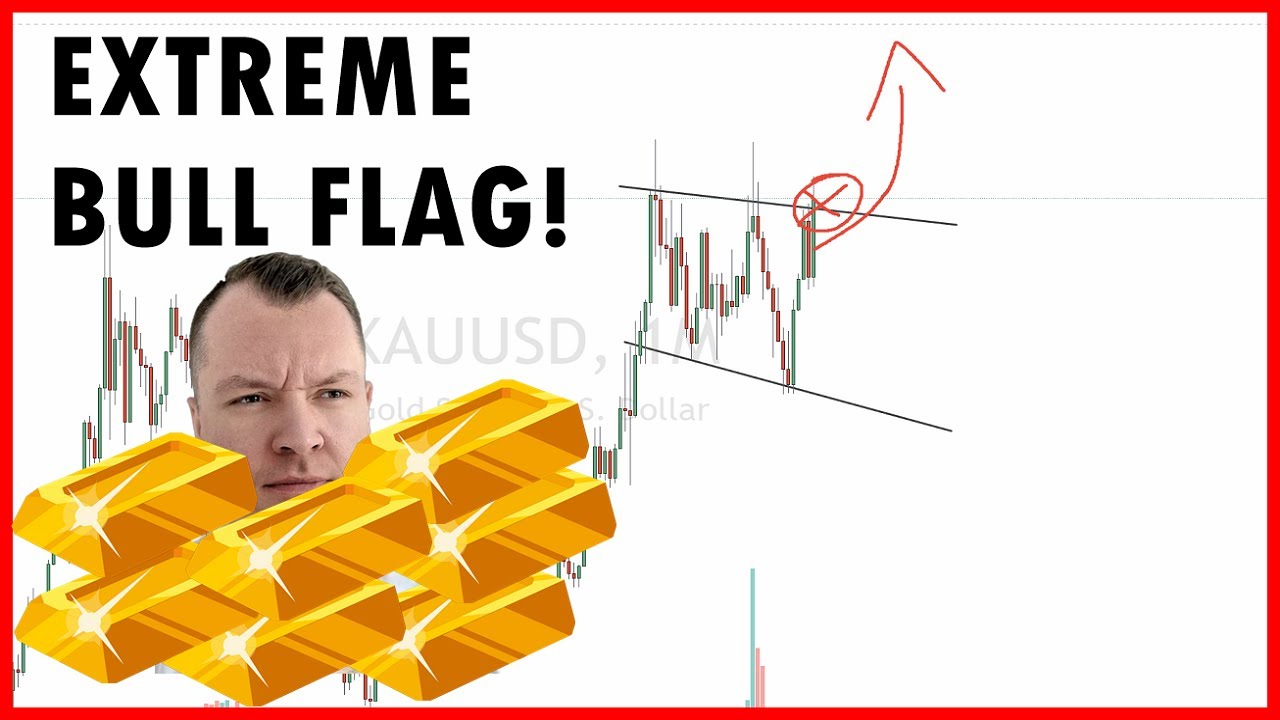
The video discusses why the gold price will soon explode due to high inflation and how traders can utilize chart patterns. The analysis shows a large bull flag pattern in the gold chart, indicating a potential breakout in the near future. The presenter suggests a long trade with a stop loss and target in the red area shown on the chart. The setup is also discussed in the weekly and daily charts.
Why the Gold Price Will Soon Explode and How Traders Can Use Chart Patterns to Profit
Introduction: The Impact of Inflation on Gold Price
The gold price has always been an important indicator of the global financial market, and it’s no different today. With inflation rates rising, the gold price is once again on the rise. In this video, Trading.de’s André delves into the reasons why traders can expect gold prices to skyrocket in the coming weeks and how they can take advantage of these trends by understanding chart patterns.
Understanding Gold Chart Signals
André starts by analyzing the current price trend for gold on the monthly chart. It’s clear that gold has been on a long-term upward trend, which was reinforced after the Corona crisis. However, traders have been surprised that despite the massive printing of money, gold prices haven’t increased as much as they were expecting.
The reason for this lies in the fact that gold is often traded against the US dollar. With the US dollar remaining robust, thanks to its position as the global currency, gold prices haven’t reacted as well to the ongoing inflation. However, other currencies, such as the Australian dollar or the Euro, have shown more robust trends when traded against gold.
Analyzing Bull-Flag Chart Patterns
André then turns to analyze the chart patterns traders can see when trading gold. One pattern that stands out is the bull-flag pattern. This pattern often signals that the market is in a period of consolidation before another price increase. This was clearly visible in the chart during the last five months, where gold was moving in a sideways direction before the bull-flag appeared.
André believes that gold will soon break out of this consolidation and start climbing again. According to him, this pattern is likely to play out soon, and traders can use this to their advantage. He also takes note of inflationary tendencies and their impact on the price of gold, pointing out that many traders miss this crucial aspect when analyzing gold charts.
Trading Gold Using Chart Patterns
To take advantage of this pattern, André suggests trading on a swing level. This style of trading allows traders to take positions that last a few days to a few weeks. Traders can take positions long in gold and hold their positions until the bullishness of the market reaches its peak. However, traders should also be mindful of risks and avoid rushing in unless they have solidified their trading plan.
Conclusion
Gold’s price movements continue to reflect the global economic trends visible across inflation and currency fluctuation. Understanding chart signals such as the bull-flag pattern can provide valuable insight into market movements, allowing traders to capitalize on market trends. Trading gold requires careful analysis of trends and risk management, along with patience and a willingness to learn from both positive and negative experiences. As traders continue to navigate through the volatile financial markets, understanding the relationship between chart patterns and market trends is an essential tool for success.

