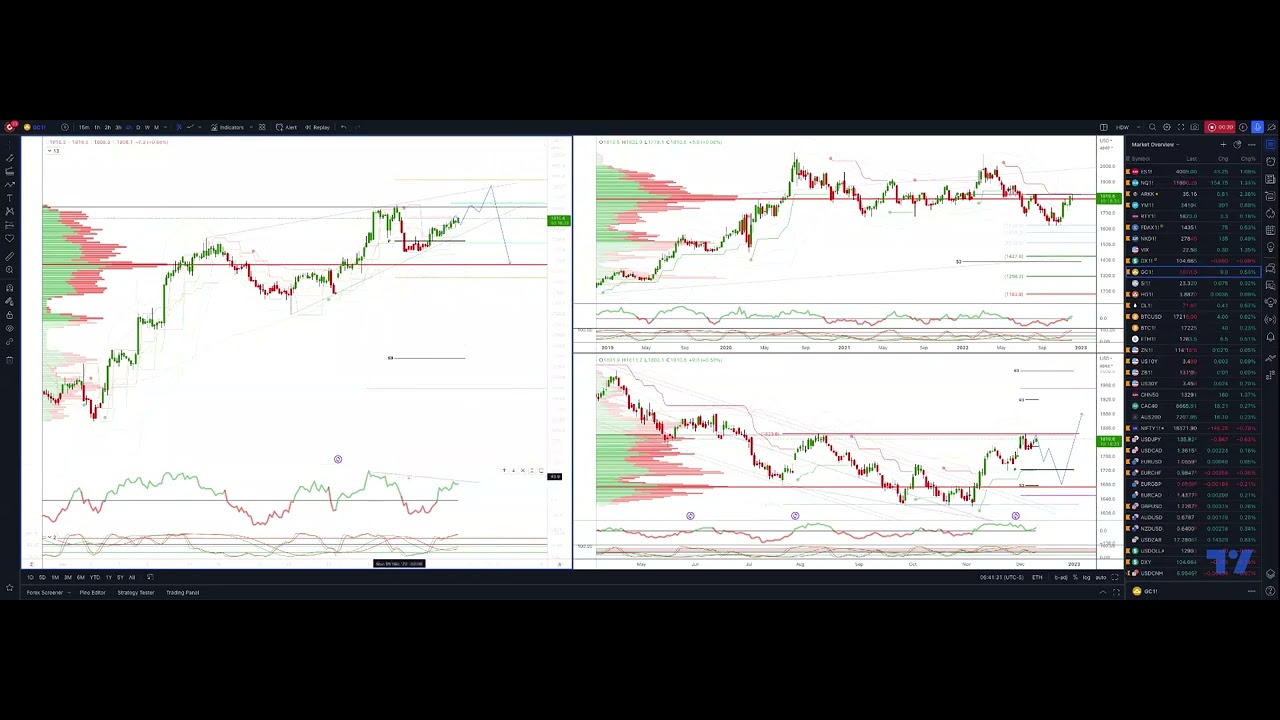
A potential ending diagonal pattern is detected on gold’s futures contract, with prices expected to go beyond prior highs to test resistance levels. Traders are advised to watch for bearish reversal patterns and manage their risks.
Analyzing Gold Market: Technical Training View
Introduction
Gold has always been a sought after commodity for investors around the world. In recent times, it has attracted more attention due to the economic slowdown caused by the pandemic. In this article, we will analyze the gold market using technical indicators and chart patterns to understand the direction of price movements.
Ending Diagonal Pattern
The four-hour time frame shows a potential ending diagonal pattern. This pattern is identified by a series of lower highs and higher lows, culminating with a sharp decline. To confirm this pattern, we need to see prices extend through the prior highs at 1823 and test the ascending trend line resistance at 1839.
Bearish Reversal Patterns
The current trend, if confirmed, indicates a bearish reversal. The next step is to look for bearish reversal patterns as long as we maintain momentum divergence. A new high in price with no corresponding high in momentum study indicates rejection from that area, which means that traders should engage on the short side.
Support Levels
If the price breaks off the trendline support at 1811, the first target on the downside is the high volume node at 1760s. It is vital to plan the trade, trade the plan, and, most importantly, manage your risk.
Weekly Projected Range Resistance
The weekly projected range resistance is just above the 1839 trendline resistance, with a resistance level of 1845. This means that if the price manages to break through the trendline resistance at 1839, the next level to watch out for will be the weekly projected range resistance.
Gold Trading Strategies
Trading in gold requires a strategic approach to minimize risk and maximize profits. One way to trade gold is through futures contracts. Futures contracts help traders to lock in a price for an asset at a specific time in the future. This strategy provides flexibility and liquidity.
Another popular way of trading gold is through exchange-traded funds (ETFs). ETFs track the performance of gold prices and are traded on stock exchanges. Compared to futures, they offer lower fees and higher trading volumes.
Conclusion
In conclusion, the technical training view suggests that the gold market has potential for a bearish reversal. Traders should look out for bearish reversal patterns and manage risk while planning trades. The weekly projected range resistance is the next critical level to watch out for if the price breaks through the trendline resistance. Understanding gold trading strategies is essential to minimize risks and maximize profits.

