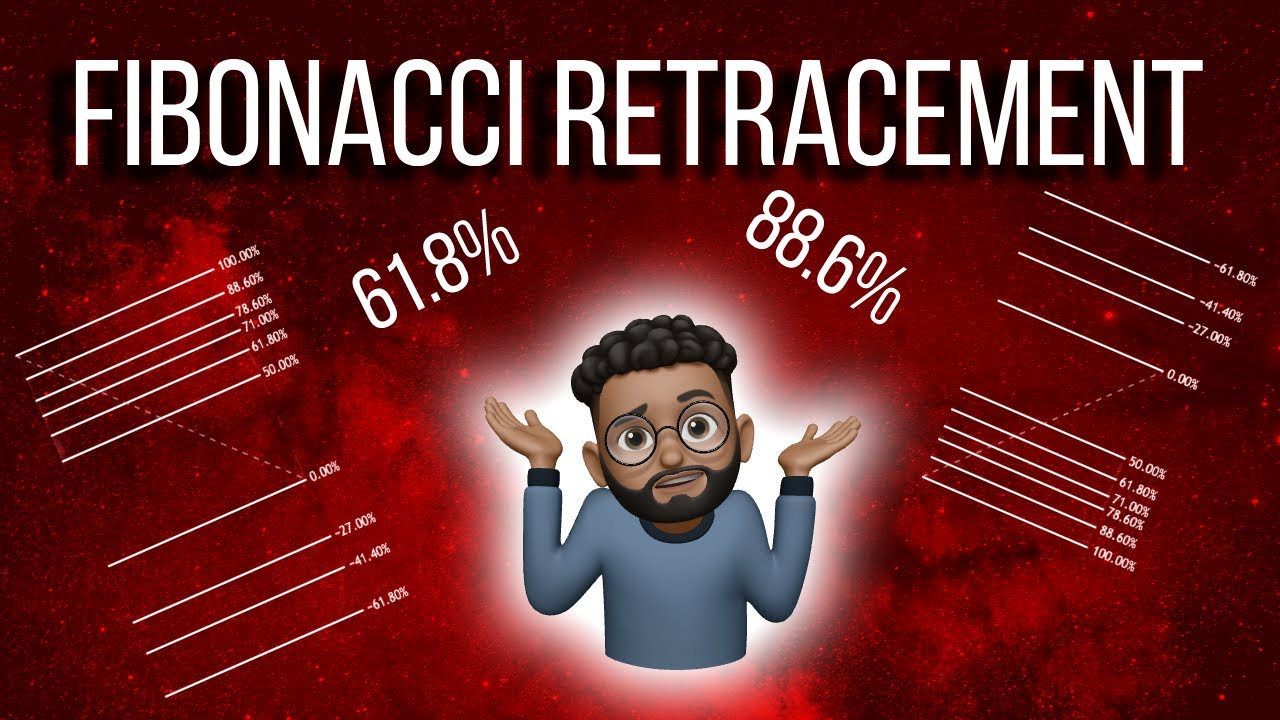
The video discusses Fibonacci retracements as a measurement tool in trading, including how to use retracement levels to buy low and sell high. The video also warns about using commonly used fib levels, which can make traders vulnerable to market manipulation, and suggests preferred levels for take profit points. Chart examples are provided for illustration.
Fibonacci Retracements: Do They Actually Work in the Markets?
Introduction
Mentorship openings filling up quickly
Explanation of Fibonacci Retracements
Fibonacci Retracement Levels
Example of Fibonacci Tool in Downtrending Market
Looking for Sell Scenarios
Example of Fibonacci Tool in Uptrending Market
Looking for Buy Scenarios
Utilizing Fibonacci Extension Ratios for Take Profit Points
Issues with Using 61.8 Retracement Level
Preferred Retracement and Extension Levels
Chart Examples
Understanding Fibonacci Retracements
Fibonacci retracements are a popular technical analysis tool used by traders to predict future price action in the market. It is designed to give an indication of where a retracement or pullback may occur, based on the size of an impulsive move. Think of it as a measurement tool used to identify potential levels of support or resistance.
Fibonacci Retracement Levels
Fibonacci retracement levels include the 100%, 88.6%, 78.6%, 71%, 61.8%, 50%, and 0% retracement levels. The extension levels are the minus 27%, minus 41.4%, and minus 61.8% levels. These levels indicate where price may potentially retrace to, based on the size of an impulsive move.
Example of Fibonacci Tool in Downtrending Market
In a downtrend, using the Fibonacci tool to measure an impulse can give an indication of where the next lower high may form. This can help traders identify premium levels to sell at. Sell scenarios can be found between 50% and 88.6% retracement ratios.
Example of Fibonacci Tool in Uptrending Market
In an uptrend, using the Fibonacci tool to measure an impulse can give an indication of where the next lower low may form. This can help traders identify discounted levels to buy at. Buy scenarios can be found between 50% and 88.6% retracement ratios.
Utilizing Fibonacci Extension Ratios for Take Profit Points
Fibonacci extension ratios are used to give traders general areas for take profit points. Retail traders tend to use the 61.8% retracement level, making their stop losses vulnerable to market manipulation. The preferred retracement levels are between 71% and 78.6%, with a first preferred extension level being minus 24%.
Issues with Using 61.8 Retracement Level
The 61.8% retracement level is widely used by retail traders, making it vulnerable to market manipulation. Market makers may force price into deeper retracement levels to trigger stop losses.
Preferred Retracement and Extension Levels
Preferred retracement levels are between 71% and 78.6%, with a first preferred extension level being minus 24%. These levels offer more protection against market manipulation and can help traders avoid common pitfalls.
Chart Examples
Chart examples are useful for illustrating how the Fibonacci tool can be used in real trading scenarios. Examining past price action can help traders make more informed decisions in the future.
Conclusion
Fibonacci retracements can be a powerful technical analysis tool when used correctly. By understanding how to use the Fibonacci tool to measure impulsive moves, traders can identify potential levels of support and resistance. Preferred retracement and extension levels can offer more protection against market manipulation and reduce common pitfalls for retail traders.

