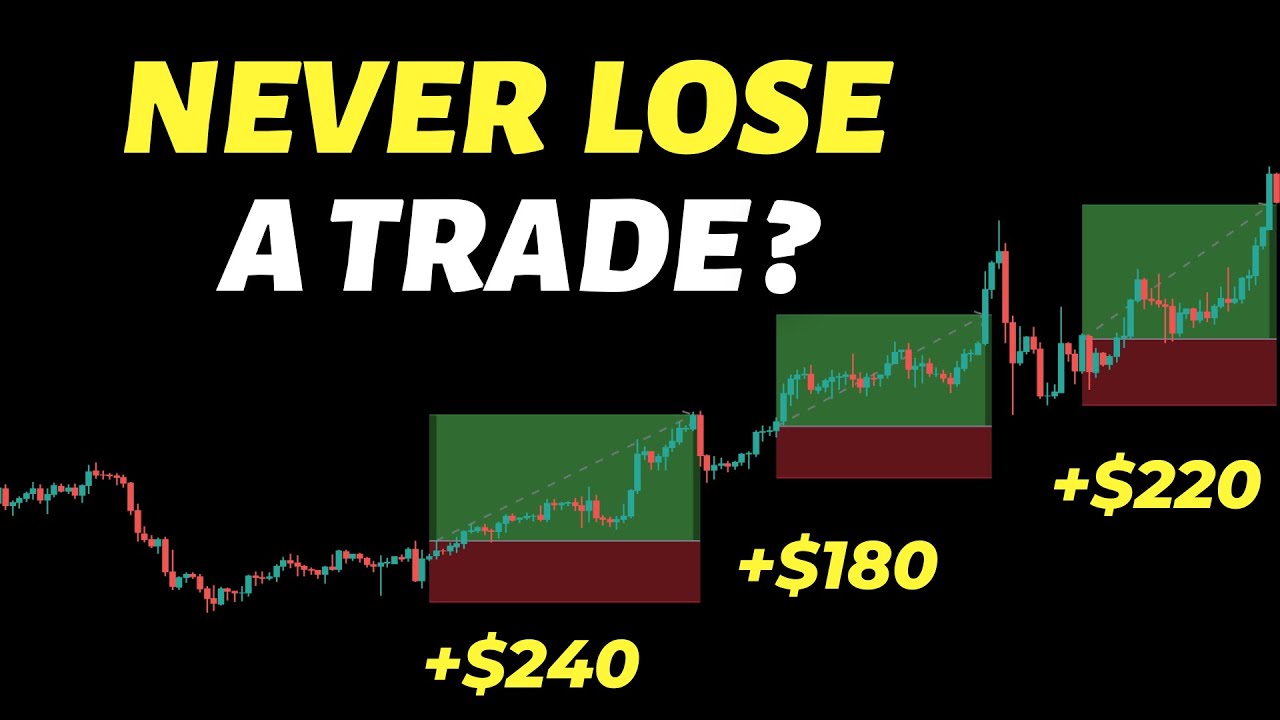
A trading strategy using the Fibonacci retracement tool is tested without using indicators. The strategy has two different methods with varying results.
Testing Trading Strategies Without Indicators: An In-Depth Analysis
Introduction
Trading strategies without indicators have been gaining popularity recently, and it’s not hard to see why. With the overwhelming number of indicators available in the market, many traders find it challenging to determine which ones are more effective. Moreover, indicators can be subjective, as traders may interpret them differently. In this article, we’ll be focusing on one such trading strategy that doesn’t require the use of any indicators. We’ll test this strategy, examine its trading rules, backtest it, and compare it to a new way of using the Fibonacci retracement tool.
The Strategy
The creator of this strategy, Supercenters, claims that it works perfectly well on the price of gold on a four-hour time frame. The strategy only consists of one tool, the Fibonacci retracement tool, and we’ll be using it in a particular way. The first step is to adjust the tool by checking an option in the style section and removing some levels. Next, we need to change two levels – the 8.382 level to 8.33 and the next level to 0.66. Once we’ve made these adjustments, we’re ready to trade.
The Trading Rules
For long trades, we first select the Fibonacci retracement tool and draw it from the recent swing high to the recent swing low. We wait for the price action to cross and close above the 0.33 level, and only when this happens, we can place a buy order at the close of our trigger candlestick. Our stop-loss is set slightly below the zero level, and our take-profit targets are set at the 0.66 level. The opposite is true for short positions. We wait for the price action to break below the 0.33 level, and only then can we place a sell order at the close of our trigger candlestick. Our stop-loss is set slightly above the zero level, and our take-profit targets are set at the 0.66 level. If the price action makes a new swing high, we adjust the Fibonacci accordingly.
Example Trades
We’ll now look at some example trades to help better understand these rules. In the first example, we see the price action breaking above the 0.33 level, and we enter a long position. The trade turns out to be successful since the price action reaches our take-profit target. In the second example, the price action broke below the 0.33 level, and we enter a short position. Unfortunately, this trade wasn’t profitable. The third example shows an opportunity to go long as the price action has been making lower lows and lower highs. We draw the Fibonacci retracement tool and wait for the price action to break above the 0.33 level. We enter a long position, and this trade turns out to be successful. The fourth example shows an opportunity to go short, but this trade doesn’t end up profitable as we’re going against the trend.
Backtesting and Results
We’ve backtested this strategy 100 times to see how well it performs in different market conditions. The win rate is 65%, and the account size increased by 31.92%. However, the equity curve is all over the place, and we had massive drawdowns of around 20%. The profit factor is only 1.42, and we had ten consecutive wins against four consecutive losses. Overall, the strategy is making money, but the risk-reward ratio could be better.
Alternative Trading Method
We tried a different way of using the Fibonacci retracement tool to see if we could improve the results. This method involves not making any adjustments to the tool. The rules for long trades require that the price action is in an uptrend, and we draw the Fibonacci level from the recent swing low to the recent swing high. We wait for the price action to break below the 0.33 level, and the final confirmation for entering a long trade is when the price breaks back up. Our stop-loss is set at the 0.66 level, and we target one and a half times the risk. We move our stop-loss to break even if the price action reaches the zero level. The rules for short trades are the same, but we draw the Fibonacci retracement from the recent swing high to the recent swing low.
Results of the Second Backtesting
The win rate for this method dropped to 61%, likely due to changing the risk-reward ratio. However, the profit after 100 trades was higher, and the equity curve was much smoother. The drawdowns were much lower, and the profit factor increased to 1.91. We had nine consecutive wins against six consecutive losses.
Conclusion
In conclusion, while the initial strategy is making money, the risk-reward ratio could be better, and the equity curve isn’t as smooth as we’d like it to be. The alternative method showed better results, with a higher profit after 100 trades, and a much smoother equity curve. However, traders should always remember that backtesting results are not always indicative of future performance. Therefore, it’s essential to test any strategy with a demo account before using real money.

