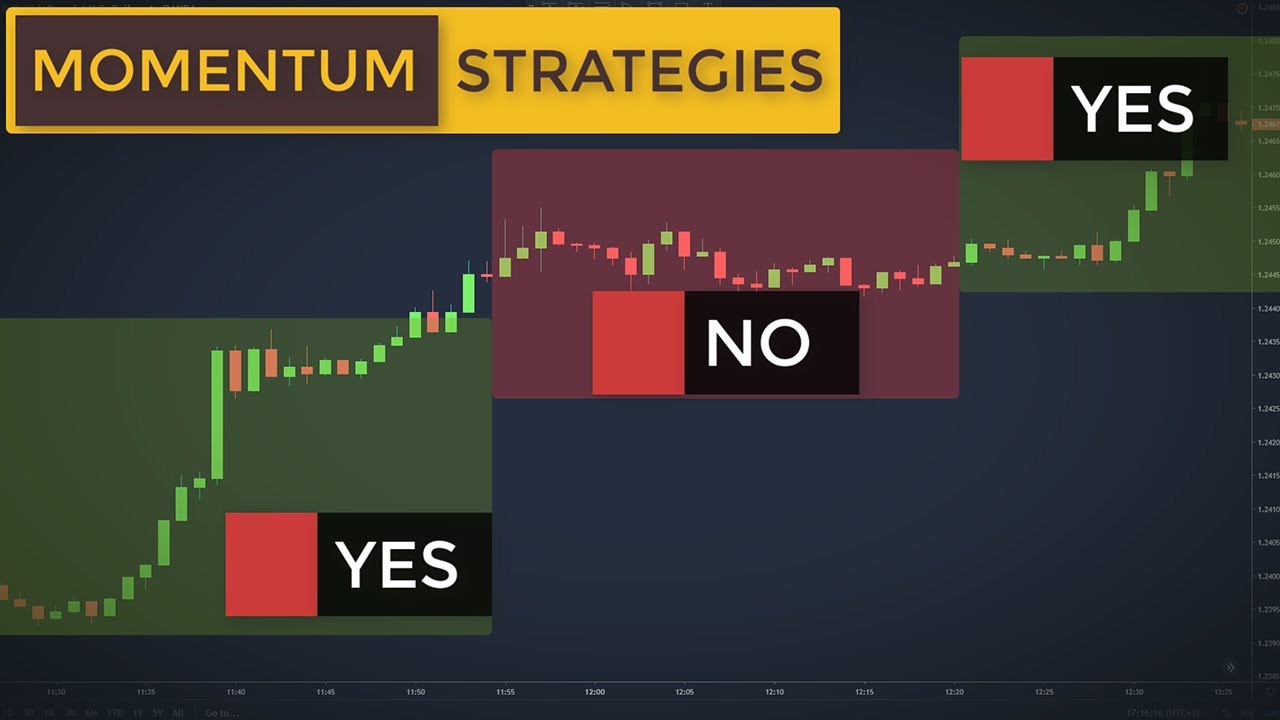
Learn how to trade using momentum indicators which compare recent price movement with past movement to identify trends and signal entry points. Use it with caution and always consider other factors such as key levels and support and resistance lines to confirm the trend. Look for divergences between price action and momentum to identify trend reversals and always enter trades in the direction of the primary trend indicated by the 200-period exponential moving average.
Momentum Indicator: How to Use It to Your Advantage
Introduction
The market can be difficult to navigate, especially when the price moves in unpredictable directions. That’s where momentum indicators come in. In this article, we’ll discuss how to use momentum indicators to identify market movement and take signals in order to synchronize with the market when it’s ready to make a significant move.
What Is a Momentum Indicator?
A momentum indicator is an oscillator that measures the strength or speed of a price movement. It compares the most recent price to a previously determined price and measures the velocity of the price change. A faster increase in price will result in a bigger increase in momentum indicator, while a faster decrease in price will result in a bigger decrease in the momentum indicator.
How to Read the Momentum Indicator
The most commonly used settings for the momentum indicator are 7, 14, or 21. Settings with values over 21 make the indicator less sensitive, resulting in fewer but higher quality signals and a smoother line of the indicator. Settings with values below 10 make the indicator oversensitive, resulting in more market noise and many false signals.
If the momentum indicator is above the 0 level, this signals that the market bias is on the upside. If the momentum indicator is above the 0 level and the market price is increasing, this signals that the trend is accelerating. If the momentum indicator starts declining but is still above the 0 level, this means that the trend is on the upside but at a reduced rate, indicating that the market is losing upward momentum.
If the momentum indicator is below the 0 level, this signals that the market bias is on the downside. If the momentum indicator is below the 0 level and the market price is decreasing, this signals that the downtrend is accelerating. If the momentum indicator starts increasing but is still below the 0 level, this means that the trend is still on the downside but at a reduced rate, signaling that the market is losing downward momentum.
How to Trade with Momentum Indicator
One common but not always effective way traders use the momentum indicator is by taking signals when the oscillator crosses the 0 level. A buy signal is generated when the momentum indicator crosses above zero, and a sell signal is generated when it crosses below zero.
However, the momentum indicator should never be used as a standalone tool. Traders should pay attention to key levels, identify major areas of support and resistance, and use the momentum indicator as an additional confirmation instrument to confirm their bias.
When used in conjunction with price action analysis and key levels, the momentum indicator can identify high probability trade setups. It can also detect divergences, which occur when price action differs from the evolution of momentum oscillator, potentially indicating a reversal. Traders can enter when they spot a divergence in the direction of the trend, when the momentum crosses below or above the 0 line.
Conclusion
The momentum indicator is a useful tool for identifying market trends and taking signals to synchronize with the market when it’s ready to make a significant move. However, it should never be used as a standalone tool. Traders should pay attention to key levels, identify major areas of support and resistance, and use the momentum indicator as an additional confirmation instrument to confirm their bias. With practice, traders can effectively use momentum indicators to identify high probability trade setups and protect against false signals.

