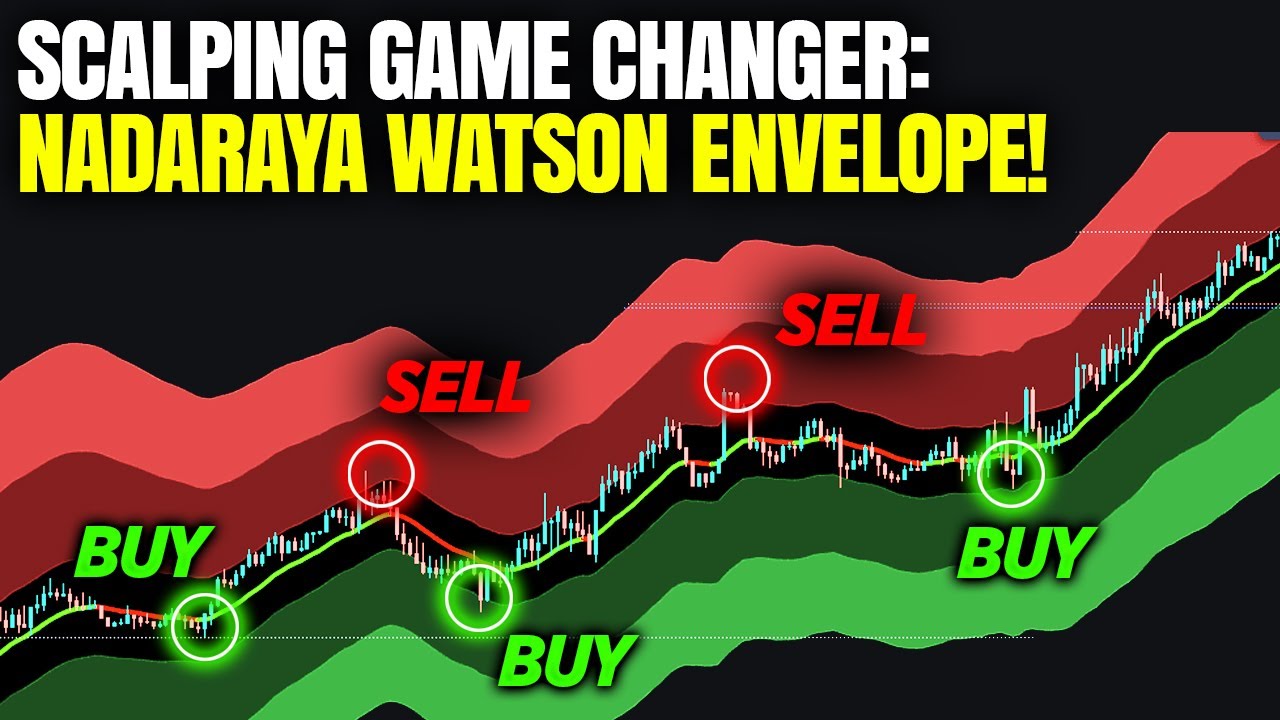
Discover the Holy Grail of scalping trading strategies with the Nataraya Watson regression indicator on TradingView. It identifies potential overbought or oversold zones and can be combined with the RSI for a high win rate and risk-to-reward ratio. Test it on different time frames and instruments.
Uncovering the Holy Grail of Scalping Trading Strategies
Are you tired of missed opportunities in the market?
Introducing the Nadaria Watson Regression Indicator
Why is the Nadaria Watson Regression different?
Comparing Moving Average and Kernel Regression
Using the Kernel Regression Baseline for Trading
Adding the Nadaria Watson Regression Indicator to Your Chart
Understanding Envelope Bands in Technical Analysis
Adding RSI to Complete the Trading Strategy
Customizing Indicators for Easy Readability
Applying the Trading Strategy to Different Time Frames and Instruments
Rules for Buy or Long Trades
Example: Trading the Euro USD on a Five Minute Time Frame
Example: Trading BTC USD on a Five Minute Time Frame
Rules for Sell or Short Trades
Example: Trading USD JPY on an Hourly Time Frame
Combining Indicators for a Winning Trading Strategy

