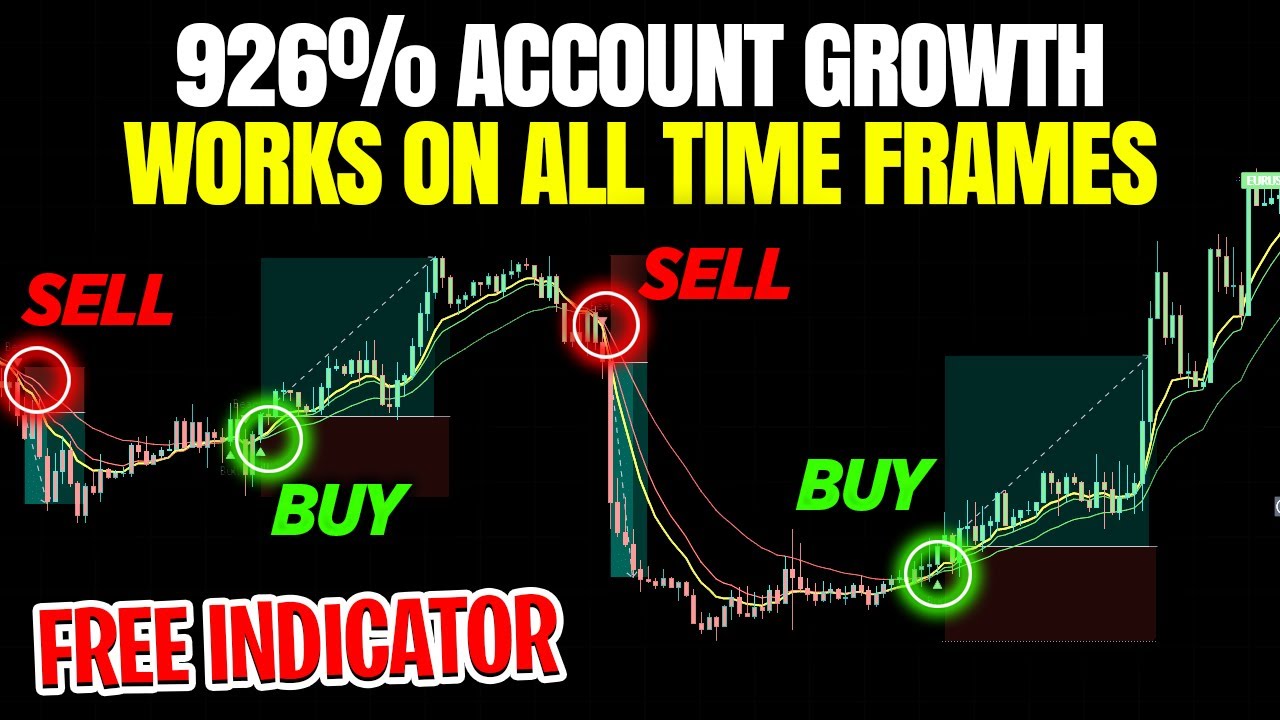
A free buy sell indicator on Trading View can help traders determine when to enter or exit trades easily. The Macro Trend Scanner indicator is simple and clear, producing buy and sell signals when the two moving average graphs cross each other. Traders can use this strategy on all time frames and instruments. The strategy can be profitable when traders use the appearance of bearish or short signals and bearish candles below two signal lines to enter sell trades, and bullish candles above both moving average lines to enter buy trades. Adding the Moving Average Convergence Divergence (MACD) indicator and a 200 moving average line can further improve the accuracy of the strategy. The indicator can be used for cryptocurrencies too.
Stop Guessing When to Buy and Sell: Let This Free Buy-Sell Indicator Do the Work for You
Introduction
Most traders are constantly looking for the next big thing that will help them make profitable trades. Oftentimes, they scour the internet to find the best buy and sell indicators that can boost their chances of success. In this article, we will discuss a free buy-sell indicator that can help eliminate the guessing game out of trading.
The Macro Trend Scanner by BTC_Charlie
The Macro Trend Scanner is a simple and clear buy-sell indicator that traders can use on Trading View. It is an excellent tool for those who prefer to use technical analysis to identify potential trading opportunities. The indicator contains two moving average graphs: a slow-moving average graph and a fast-moving average graph. The system produces signals when the two lines cross each other, with a downward cross triggering a bearish or sell signal and an upward cross generating a bullish or buy signal.
Using the Macro Trend Scanner for Trading
Traders can use the Macro Trend Scanner alone to make profitable trades. The strategy involves looking for two conditions to be met before entering a trade: when a bearish or short signal appears and when bearish candles form below the two signal lines. When these conditions are met, traders can enter sell trades and place their stop-loss above the recent high, targeting a two-to-one risk-to-reward ratio. Conversely, for a buy signal, traders look for the opposite conditions: when a bullish signal appears, and the long side of the candle closes above both moving average lines. They can then enter a buy trade, placing their stop-loss below the recent swing low, and targeting a one-to-two risk-to-reward ratio.
Examples of Using the Macro Trend Scanner in Different Time Frames
The Macro Trend Scanner can be used on different time frames, enabling traders to identify potential trading setups across various markets. For example, on the 30-minute time frame, the indicator can help traders to capture significant moves in the market. It is essential to note that traders should always backtest any indicator they intend to use to ensure its effectiveness.
Improving the Accuracy of the Indicator
To further improve the accuracy of the Macro Trend Scanner, traders can add the MACD (Moving Average Convergence Divergence) indicator to their charts. They can then make some adjustments to the settings, such as removing the signal line and changing the histogram colors to only green and red. The MACD histogram can help traders to identify whether the market is in an uptrend or downtrend, a valuable tool in avoiding false signals. Additionally, adding a moving average exponential indicator to the chart can help traders to align themselves with the market’s overall trend and momentum.
How to Use the Macro Trend Scanner to Sell or Short a Trade
To trigger a sell or short trade using the Macro Trend Scanner and MACD indicators, traders must wait for a sell signal from the Macro Trend Scanner indicator. The MACD histogram should be below the zero line, and the price should be lower than the 200 moving average line. Once the candlestick closes, traders can enter the trade, setting their stop-loss at the previous high of the market and targeting a one-to-two risk-to-reward ratio.
Using the Indicator to Buy a Trade
Conversely, to trigger a buy trade, traders should wait for a buy signal from the Macro Trend Scanner indicator. The MACD histogram should be above the zero line, and the price should be higher than the 200 moving average line. Once the candlestick closes above the moving average line, traders can enter a buy trade, placing their stop-loss below the recent swing low and aiming for a one-to-two risk-to-reward ratio.
Conclusion
The Macro Trend Scanner is an effective buy-sell indicator that traders can use to enhance their trading strategies. By understanding how to use this free indicator, traders can simplify the trading process and make profitable trades with more confidence. Additionally, combining the Macro Trend Scanner with other indicators, such as the MACD and moving average exponential, can help traders further refine their strategies and improve their odds of success. However, as with any trading tool, traders should always conduct due diligence and test the indicator before using it in live trading.

