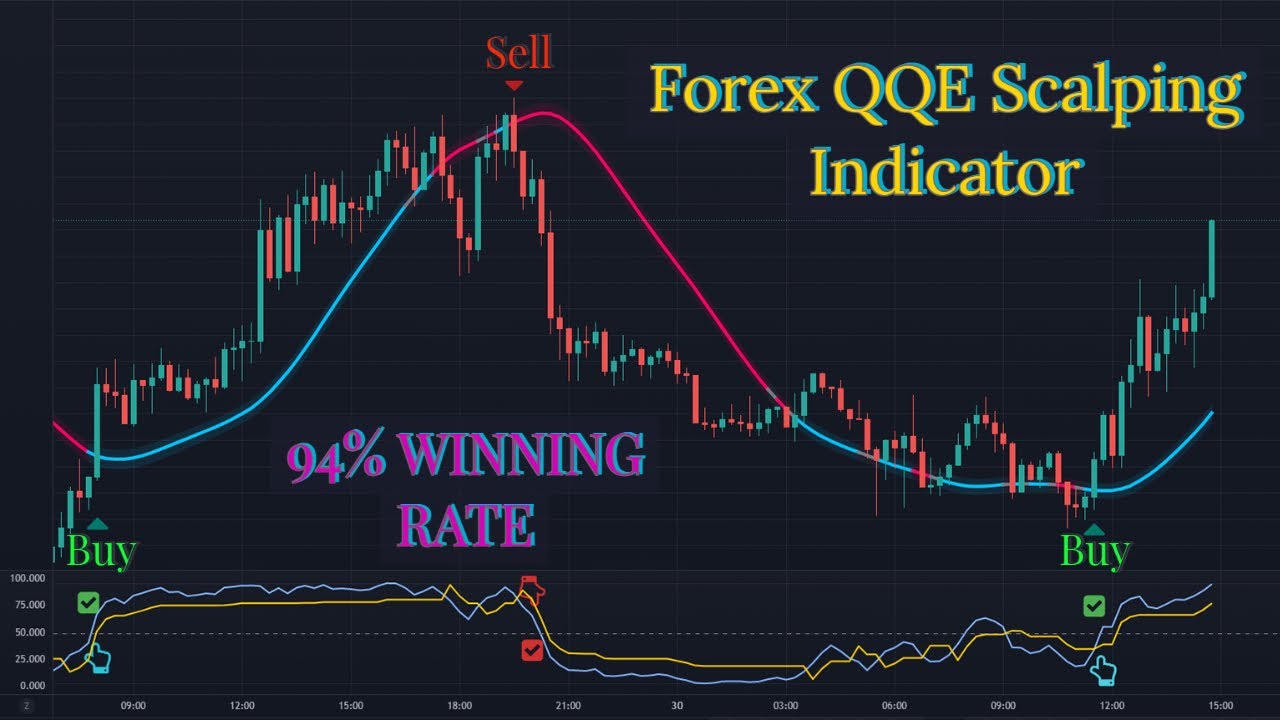
Learn how to trade using the Qualitative Quantitative Estimation (QQE) indicator, which is a momentum-based indicator to determine trend and sideways. The indicator works like a smoother version of the popular Relative Strength Index (RSI). To use the strategy, open the 15-minute chart of GBP/USD and apply the QQE WR and Connor RSI indicators. Set the upper and lower bands of the RSI to zero and drag and drop the QQE indicator on the Connor RSI. Look for signals where the WPR indicator crosses the zero line of the Connor RSI, then place a sell or buy order accordingly, with a stop loss at the previous higher or lower of the market and a risk-to-reward ratio of 1:2.
How to Trade with Qualitative Quantitative Estimation (QQE) Indicator
Introduction
Trading strategies in forex markets are not always easy to understand and implement, especially for novice traders. But, with the help of certain indicators, traders can predict market trends and increase their chances of success. In this article, we will discuss one of the most popular indicators, the Qualitative Quantitative Estimation (QQE). We will explain how it works and how it can be used to make profitable trades.
What is the QQE Indicator?
The QQE indicator is a momentum-based indicator that helps determine trends and sideways movements. It is a smoother version of the popular Relative Strength Index (RSI) indicator, but with two volatility-based trailing stop lines added to the RSI. This makes QQE a highly useful tool for predicting market trends.
Setting up the QQE Indicator Strategy
To start trading with the QQE indicator, follow these simple steps:
– Open the chart of your preferred currency pair, such as GBP/USD, for a 15-minute timeframe.
– Apply the QQEWR indicator on the chart.
– Install the Connor RSI and drag and drop the QQE indicator on the Connor RSI.
– Make some changes in the RSI indicator by setting the upper and lower bands at zero levels and hiding the Connor RSI.
– Your setup is now ready to use.
Live trade examples
Here are some live trade examples to help you understand how to use the QQE indicator in real trading situations:
Example 1:
– The WPR indicator has crossed the zero line of the Connor RSI downwards.
– The blue and yellow lines have crossed, indicating a sell signal.
– Place a sell order with a stop loss at the previous high of the market.
– The risk to reward ratio should be one is to two.
Example 2:
– The WPR indicator has crossed the zero line of the Connor RSI upwards.
– The blue and yellow lines have crossed, indicating a buy signal.
– Place a buy order with a stop loss at the previous low of the market.
– The risk to reward ratio should be one is to two.
Advantages and Disadvantages of QQE Indicator Strategy
While the QQE indicator strategy can be highly profitable, it also has its advantages and disadvantages:
Advantages:
– The QQE indicator is easy to use and offers clear buy and sell signals.
– It helps traders to identify trends and sideways movements.
– The risk to reward ratio can be easily calculated.
Disadvantages:
– The QQE indicator strategy heavily relies on the WPR indicator, which can be volatile at times.
– It is not suitable for long-term trades as it focuses more on short-term trades.
– It may not be suitable for all trading styles and preferences.
Conclusion
While there is no perfect indicator or strategy for forex trading, the Qualitative Quantitative Estimation (QQE) indicator strategy can be a useful tool for traders. By following the simple steps outlined in this article, you can start using this strategy to make profitable trades. However, it is crucial to conduct thorough research and analysis before using any strategy to ensure its suitability for your trading style and preferences.

