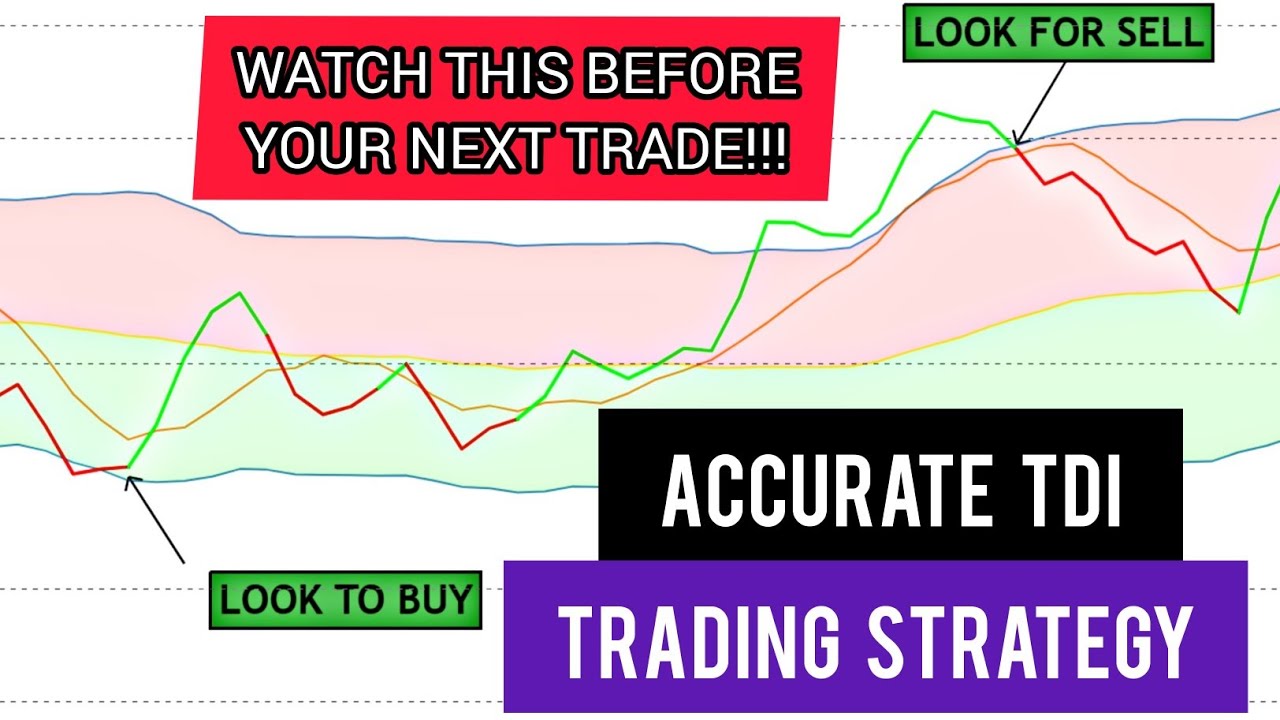
The video discusses a simple trading strategy that utilizes the Traders Dynamic Index (TDI), a combination of several common indicators. The strategy involves waiting for the market to go out of the TDI bands on the h4 timeframe, then looking for a w or m pattern on the h1 timeframe to enter a trade. The video provides examples of how to use the strategy, as well as tips for finding proper setups.
Utilizing Traders Dynamic Index: A Simple Trading Strategy
Introduction
– Explanation of Traders Dynamic Index (TDI)
– Combination of several indicators to show market volatility and sentiment
Understanding TDI Parameters
– RSI Line (Green) to read relative strength index
– Volatility bands in blue to measure upper and lower volatility for oversold and overbought scenarios
– Signal line in red to confirm return of relative strength index inside the bollinger bands
– Moving 50 or best line (yellow) to show trend of the price chart
Strategy for Trading with TDI
– Market going out of bands on H4 time frame
– RSI breaking out of the bands at 68 and 32 line on H4 time frame
– Look for W or M pattern on H1 timeframe
– Trade on second leg of W or M
– Convergence and divergence
– Find proper setup for entry
Conclusion
– Importance of H4 breakout and proper setup for entry
– Final thoughts and reminder to like and subscribe

