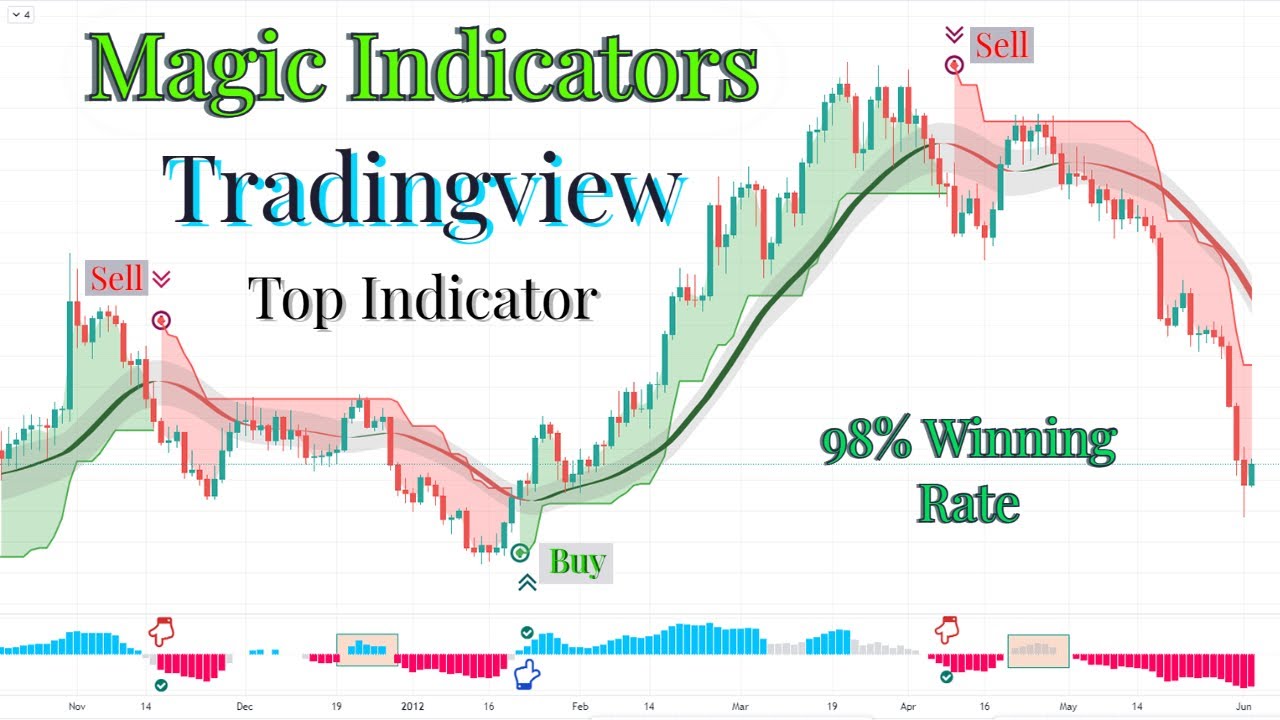
Learn how to trade with the proper Super Trend and QQE Mod Histogram indicators. Follow specific conditions for buy and sell orders, utilize risk-reward ratios, and avoid false signals. Example trades are provided, and specific setup instructions for the indicators are given.
How to Trade with Proper Super Trend with QQE Mod Histogram Indicator: The Best Strategy Revealed
Introduction
In the world of trading, indicators play a significant role in understanding market trends and making important decisions. The super trend and QQE Mod Histogram Indicator are two popular trading indicators that can be utilized in various ways to help traders make more informed decisions. In this article, we will delve into how you can trade with proper super trend with QQE Mod Histogram Indicator and reveal the best strategy for maximizing your trades.
Understanding Trading Tools
Before we dive into the strategy, it is important to understand the tools that will be used to execute it. The first tool is the super trend, which is used to determine the market trend. The red color line strip visible in the middle is known as the zoom line, while the QQE Mod Histogram Indicator is located at the bottom. These tools will be used to execute the strategy.
Trading Setup
To execute the strategy, you need to know the trading setup. When the super trend changes into an uptrend, the zoom line should be green, and the QQE Mod Histogram should be blue. If these conditions are met, place a buy order, with a stop loss at the zoom line below and a risk to reward ratio of 1:2. Conversely, when the super trend changes into a downtrend, the zoom line should be red, and the QQE Mod Histogram should be red. If these conditions are met, place a sell order, with a stop loss at the zoom line above and a risk to reward ratio of 1:2.
Avoiding False Signals
One of the challenges of trading is false signals. To avoid these, it is recommended to only place trades when all the conditions of the strategy are met. This will help you avoid any trades that may result in losses.
Trade Examples
The best way to understand the strategy is to see it in action. The following examples demonstrate how the strategy can be successfully applied in trades.
Trade 1: AUD/USD
On the AUD/USD one-hour chart, the super trend changed into a downtrend, with the zoom line and QQE Mod Histogram both red. As all the conditions of the strategy were met, a sell order was placed with a stop loss at the zoom line above and a risk to reward ratio of 1:2. The trade was successful, and the target was hit.
Trade 2: AUD/USD
Following the success of the first trade, another signal appeared on the AUD/USD one-hour chart, with the super trend changing into an uptrend, the zoom line green, and the QQE Mod Histogram blue. As all the conditions of the strategy were met, a buy order was placed with a stop loss at the zoom line below and a risk to reward ratio of 1:2. The trade was successful, and the target was hit.
Trade 3: AUD/USD
Another signal appeared on the AUD/USD one-hour chart, with the super trend changing into a downtrend, the zoom line red, and the QQE Mod Histogram red. As all the conditions of the strategy were met, a sell order was placed with a stop loss at the zoom line above and a risk to reward ratio of 1:2. The trade was successful, and the target was hit.
Trade 4: AUD/USD
While the trade appeared favorable, it resulted in a loss. As previously mentioned, no strategy works 100% of the time. It is important to manage losses and understand that they are a natural part of trading.
Trade 5: AUD/USD
Another signal appeared on the AUD/USD one-hour chart, with the super trend changing into an uptrend, the zoom line green, and the QQE Mod Histogram blue. As all the conditions of the strategy were met, a buy order was placed with a stop loss at the zoom line below and a risk to reward ratio of 1:2. The trade was successful, and the target was hit.
Trade 6: AUD/USD
Another signal appeared on the AUD/USD one-hour chart, with the super trend changing into a downtrend, the zoom line red, and the QQE Mod Histogram red. As all the conditions of the strategy were met, a sell order was placed with a stop loss at the zoom line above and a risk to reward ratio of 1:2. The trade was successful, and the target was hit.
Setting Up the Trading Indicators
To set up the trading indicators, you need to search for the super trend indicator in the search box of TradingView and click on the Super Trend option. Change the ATR period to 9 and the ATR multiplier to 3.9. Next, search for the QQE Mod in the search box of TradingView and click on the QQE Mod option. Hide the QQE line. Finally, search for the zoom in the search box of TradingView and click on the Trend Indicator AV2. Change the EMA length to 52 and the EMA length smoothing to 14.
Final Thoughts
The Super Trend with QQE Mod Histogram Indicator is a powerful trading strategy that can help traders make more informed decisions when trading major currency pairs. While there is no guarantee of success, following the strategy can help you avoid false signals and minimize your losses. By setting up the trading indicators correctly and executing the trades based on the conditions of the strategy, you can maximize your profits and achieve success in the exciting world of trading.

