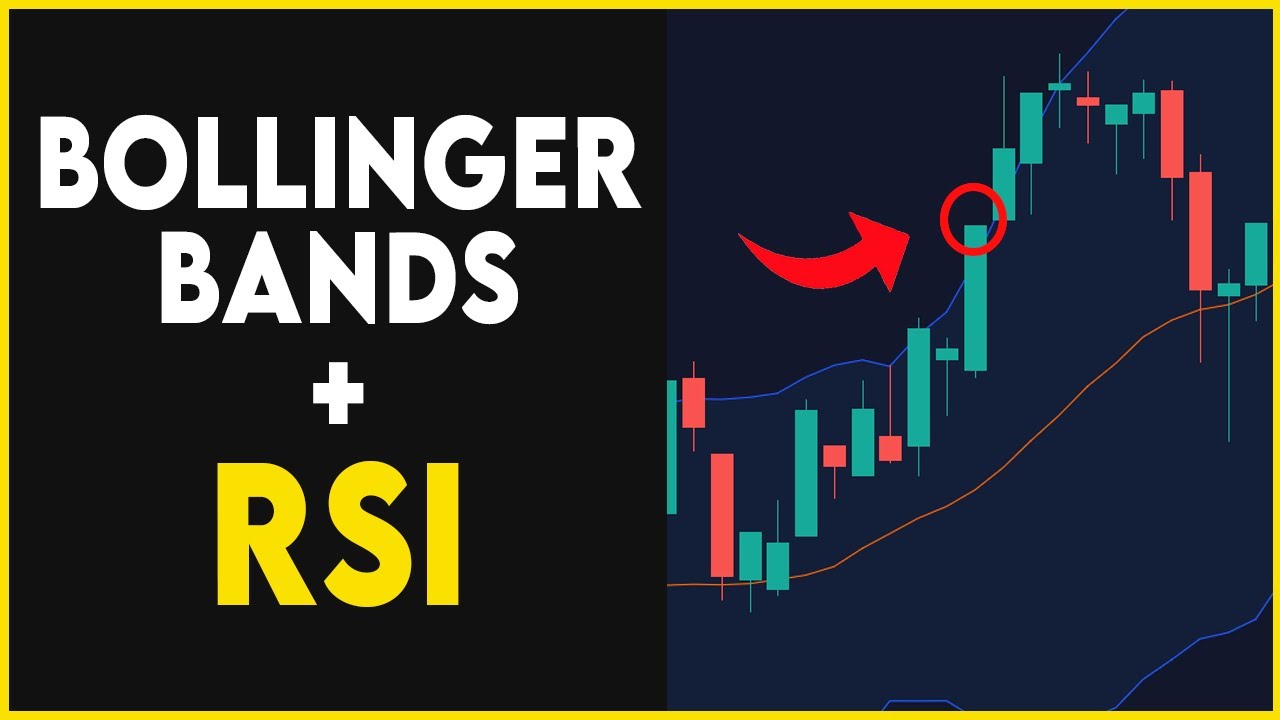
Learn a profitable trading strategy using Bollinger Bands and RSI. Set up Bollinger Bands by changing default settings and pair with RSI to predict price movement. Use mean reversion and wait for extreme RSI values, but be cautious of sideways movement. Identifying divergence can also be a great way to enter a trade.
Bollinger Bands: A Trading Strategy for Success
Introduction: Why Bollinger Bands and RS Are Key to Trading Success
When it comes to trading success, knowing which indicators to use and how to use them effectively can make all the difference. In this video, we explore a simple yet highly effective trading strategy that centers around Bollinger Bands and RSI. By pairing these indicators and utilizing mean reversion principles, traders can increase their chances of making profitable trades.
Step One: Setting Up the Bollinger Bands
For those unfamiliar with Bollinger Bands, they are an excellent way to find support and resistance levels. To set them up, head to your trading chart platform and click the indicators tab. Type in Bollinger Bands and adjust the settings to a length of 30 with a standard deviation of 2. You can also remove the background and change the lines to red for personal preference.
Step Two: Adding RSI and Making Modifications
Next, add RSI by typing it into your indicators tab and selecting the top option for Relative Strength Index. Adjust the settings to reflect an upper band of 70, a lower band of 30, and a length of 13 (instead of the default 14).
Step Three: Pairing the Indicators and Applying Mean Reversion Principles
With both indicators in place, it’s time to pair them together and apply mean reversion principles. This involves buying (going long) when the price dips below the bottom Bollinger Band and the RSI hits a value of 25 or lower. Conversely, traders should short when the price goes above the top Bollinger Band and the RSI hits a value of 75 or higher.
Crucial Tip: Recognizing Sideways Markets and Utilizing Divergence
While this strategy has a high success rate, it’s important to recognize when the market is moving sideways. During these times, it’s harder to predict price movements and avoid losses. However, by paying attention to skinny Bollinger Bands and RSI staying within a certain range, traders can recognize when a break in price movement is imminent. Additionally, traders can utilize divergence – when the price and RSI are moving in opposite directions – to make profitable trades.
Conclusion: Watch the Video and Check Out Our Other Trading Tips
By following these steps and paying attention to crucial tips, traders can use Bollinger Bands and RSI to elevate their trading success. For more comprehensive guidance, be sure to watch the video and check out our other trading tips, including an 86% win rate MACD strategy.

