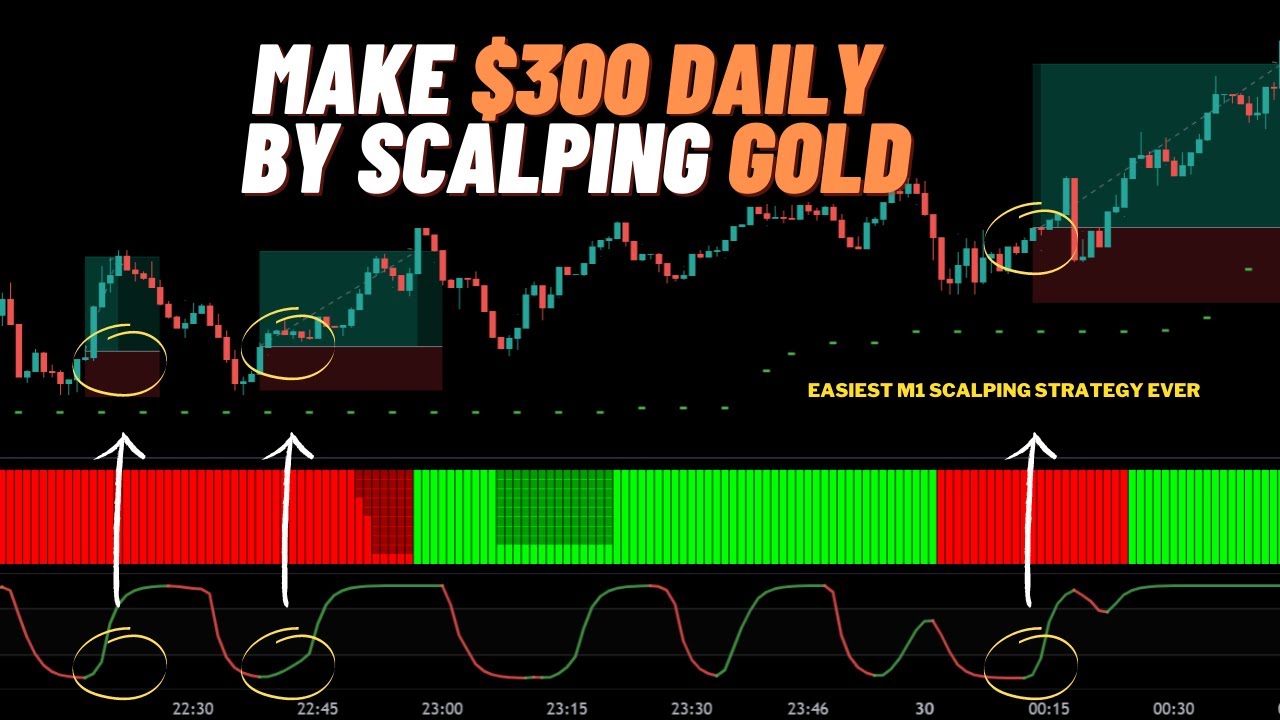
Learn a profitable scalping strategy for trading XAU/USD on one-minute charts using TradingView’s indicators. Boost your account with high profit and capture the best entry points with trend confirmation. Avoid entering when signals are invalid for maximum earnings. Apply the same strategy to other markets like stocks, Forex, and crypto.
A Profitable Scalping Strategy for the XAU/USD Market Using TradingView
If you’re looking to scalp the XAU/USD market, TradingView is an excellent platform to use. With its wide range of technical indicators and charting tools, it can help you identify profitable entry and exit points, and capture high profits.
In this article, we’ll walk you through a profitable scalping strategy for XAU/USD on one-minute charts using TradingView’s indicators. We’ll cover the main idea behind the strategy, the three indicators you’ll need, how to enter a trade, determining stop loss and targets, and identifying perfect buy and sell setups. Plus, we’ll discuss the importance of donkey and trend ribbon color, and show you examples of signals to avoid.
Understanding the Scalping Strategy
Scalping is a trading style that involves opening and closing trades within a short time frame, usually a few minutes or less. Scalpers aim to capture small profits from multiple trades throughout the day, rather than holding positions for long periods of time.
The XAU/USD market, which tracks the price of gold against the US dollar, is a popular market for scalping. Gold is a highly volatile asset that can experience large price movements in a short period of time, making it an attractive market for scalpers.
To scalp the XAU/USD market, you need a trading strategy that can identify profitable entry and exit points. One way to do this is by using TradingView’s technical indicators, which can help you analyze price trends and identify potential trading opportunities.
The Three Indicators Needed for this Strategy
The three indicators you’ll need to use for this scalping strategy are the Exponential Moving Average (EMA), the Relative Strength Index (RSI), and the Stochastic Oscillator.
- Exponential Moving Average (EMA)
The EMA is a commonly used technical indicator that helps traders identify trends in price movements. It calculates the average price of an asset over a specific time period, giving more weight to recent price data.
For this scalping strategy, we’ll use the 10-period EMA as a trend filter. The EMA will help us identify the direction of the trend and determine whether to enter a long or short trade.
- Relative Strength Index (RSI)
The RSI is a momentum oscillator that measures the speed and change of price movements. It oscillates between 0 and 100 and is used to identify overbought and oversold conditions in the market.
For this scalping strategy, we’ll use the RSI to confirm trend direction and identify potential entry points. When the RSI is above 50, it indicates a bullish trend, and when it’s below 50, it indicates a bearish trend.
- Stochastic Oscillator
The Stochastic Oscillator is another momentum oscillator that helps traders identify overbought and oversold conditions in the market. It oscillates between 0 and 100 and is used to identify potential trend reversals.
For this scalping strategy, we’ll use the Stochastic Oscillator to confirm trend direction and identify potential exit points. When the Stochastic Oscillator is above 80, it indicates an overbought market, and when it’s below 20, it indicates an oversold market.
Minor Adjustments to Be Made Before Strategy Application
Before applying this scalping strategy, there are a few minor adjustments you’ll need to make to your TradingView chart settings. These adjustments will help you identify potential trading opportunities and avoid invalid signals.
- Chart Type and Time Frame
First, you’ll need to change your chart type to a one-minute candlestick chart. This will allow you to analyze price movements in real-time and identify.

