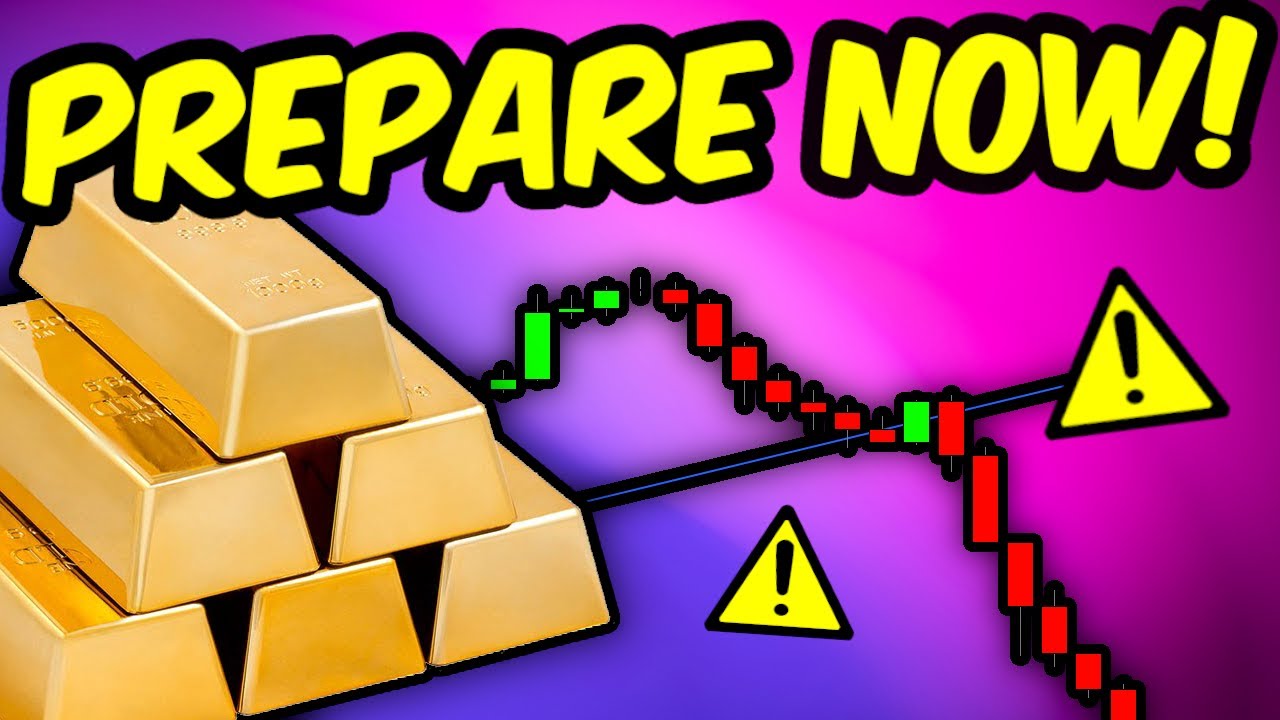
The video provides updates on gold price prediction and technical analysis, highlighting the importance of the daily time frame and recent technical signals. The gold price is currently testing support and resistance levels, and a potential reversal to the downside is indicated by a bearish divergence. Short-term support levels include an upward sloping blue line and a gray area around 1730-1718, while the upside scenario would require a strong daily candle close above 1807 and potentially reaching 1907. The video concludes with a call to action for viewers to like, subscribe, and hit the notification bell.
Gold Trading: Latest Technical Data and Predictions
Introduction
Gold traders have recently witnessed some significant technical data that they need to be aware of. In this article, we will discuss the latest technical analysis and gold price predictions.
Daily Time Frame and Historical Significance
Currently, the focus is on the daily time frame, where each Candlestick represents one day. In this time frame, a bearish divergence is forming between the price and momentum indicators. This divergence indicates a potential reversal to the downside, which could be a cause for concern for gold bulls.
In recent times, gold prices went down to test the support level and then bounced back up. The selling pressure on gold prices has been happening precisely at the resistance level, which was predicted in a previous gold update at $1807. The primary reason being the historic significance of this level.
Short Term Support Levels
In the short term, one support level to look out for is the lower blue line in the chart, which has acted as resistance and support several times. If the bears continue to hold control, a support touch may occur once again.
If gold prices fall below this level, the next support level to look out for is around $1,730 to $1,718, situated in the gray area in between. The reason for paying attention to this support level is due to the support coming in recently and historically.
Another support level to keep an eye on is around $1,680, where the beautiful double bottom was witnessed back in March 2021.
Upside Scenario for Gold Prices
Breaking the resistance level at $1,807 in the short term is crucial for gold prices to reach the upside scenario, which is at $1907. This level has acted as both resistance and support in the past, making it an important level to keep an eye on.
Conclusion
In summary, gold traders need to keep a close eye on the technical data and predictions to make informed trading decisions. The short term and long term support levels and upside scenarios have to be watched closely. A strong daily candle close above $1,807 could signal a bullish trend in gold prices.

