In this video, Nick shares a technique for better exits using Fibonacci extensions. He explains how to draw them and use them to predict potential trend continuations for better profit-taking. Fibonacci is based on a mathematical equation and can be used for trend following in any timeframe. Fibonacci retracements are for better entries, while Fibonacci extensions are for better exits. It’s important to note that Fibonacci is not perfect and can vary based on different interpretations. Fibonacci was created by a person named Fibonacci and is a recognizable pattern found in the universe, including the markets.
How to Use Fibonacci Extensions to Improve Your Trading Exits
Introduction: The Importance of Trend Following and Fibonacci Concepts
As a trader, it’s important to have a solid understanding of trend following and Fibonacci concepts. These techniques can be applied to any time frame, and can help you make better entry and exit decisions. In this article, we will focus specifically on Fibonacci extensions and how they can be used to find potential exit points on a trend following strategy.
Understanding Fibonacci Extensions: Finding Potential Exit Points
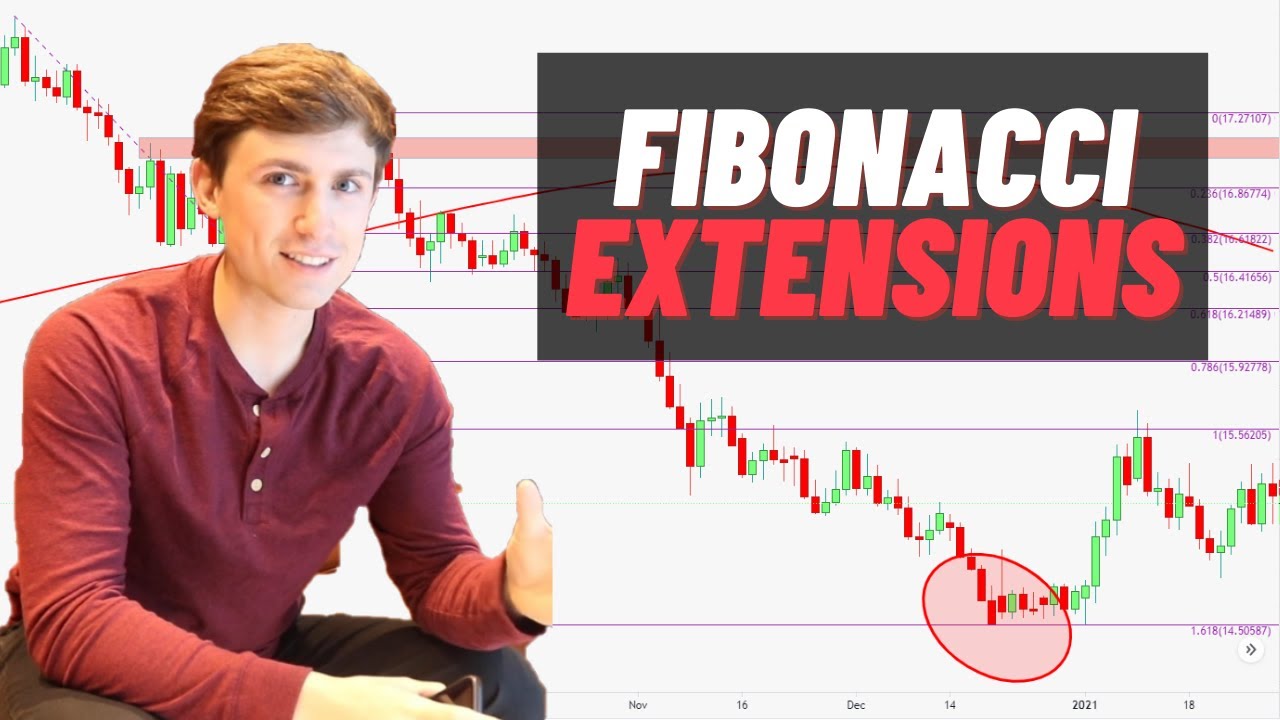
Fibonacci extensions are a way to look for potential exits on a trend following strategy. The goal is to find points on the chart where the trend is likely to continue and potentially reach an extreme extension. This can help traders identify potential areas to take profit or exit a position.
Drawing Fibonacci Extensions: Where to Start
To draw Fibonacci extensions, start at the bottom of a trend and go to the top of a completed trend. Then, mark where the pullback came back to. This will give you an idea of where the trend may potentially continue to.
Using a Real-Life Example: Applying Fibonacci Extensions to the Australian Dollar vs Japanese Yen
Let’s take a look at a real-life example to better understand how Fibonacci extensions work. We’ll focus on the Australian dollar vs Japanese yen using a four-hour chart. We can see a clear uptrend push by buyers on the Aussie yen. This is the first part of our segment.
The next step is to mark the pullback point. In our example, the market pulled back to a specific point. We can assume that we got in on this pullback and look to get long.
Once we are in the trade, we can use Fibonacci extensions to identify potential exit points. The levels produced by the Fibonacci tool represent the percentage move of a relative to the initial trend move. This can help us identify where the trend may potentially go to and give us an idea of where to take profit or exit the position.
Tips for Using Fibonacci Extensions Effectively
To use Fibonacci extensions effectively, it’s important to keep a few things in mind. Firstly, remember that Fibonacci is based on a mathematical equation. While you don’t need to be a math expert, it’s helpful to understand the basic principles behind the tool.
Secondly, remember that Fibonacci extensions are trend following tools. They assume that the trend will continue and can help you identify potential areas to take profit or exit a position.
Finally, keep in mind that Fibonacci extensions are not perfect, and people may draw them differently. It’s important to use them as a guide and to supplement your trading strategy with other technical analysis tools.
Conclusion: Using Fibonacci Extensions to Improve Your Trading Exits
In conclusion, Fibonacci extensions can be a useful tool for traders looking to improve their exit strategies. By understanding how to draw them and applying them to a trend following strategy, traders can identify potential exit points and make more informed trading decisions.
Remember to keep in mind the principles of trend following and Fibonacci concepts when using this tool, and to supplement it with other technical analysis techniques. With practice and patience, Fibonacci extensions can be a valuable addition to any trader’s trading arsenal.
