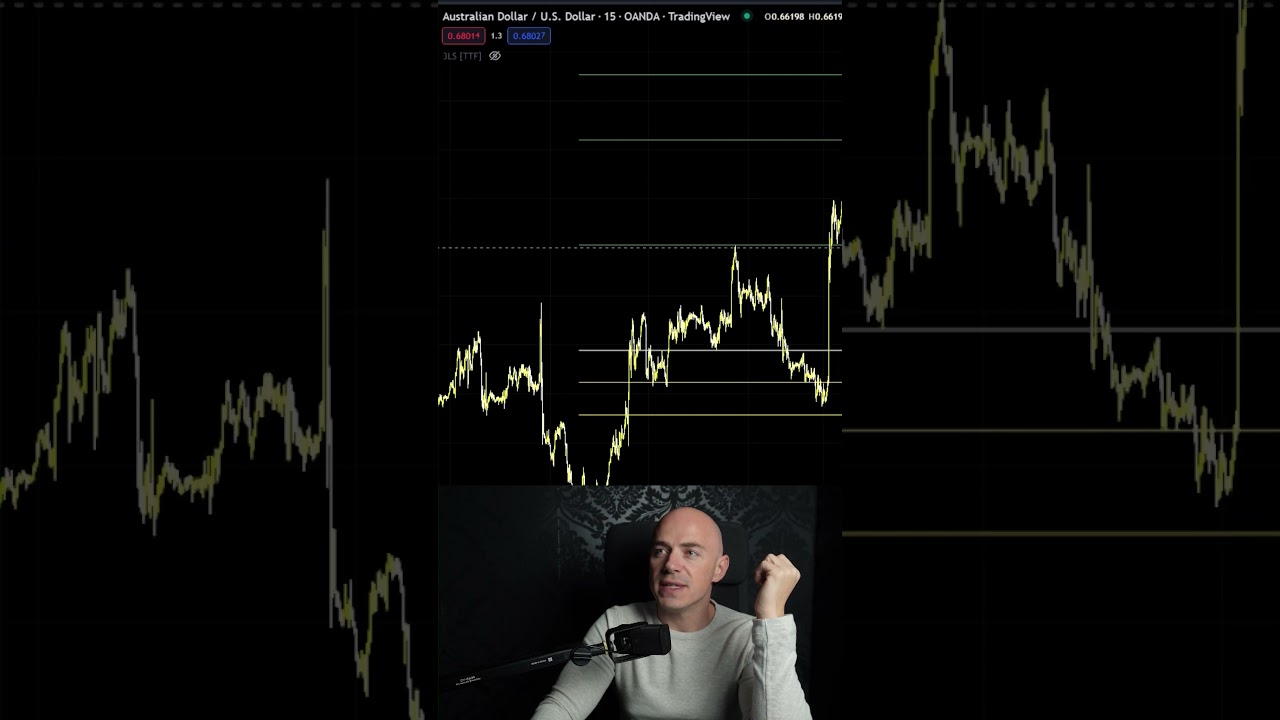
Instructions for day traders on using Fibonacci retracement tool to identify price targets after a significant move up, with specific settings and pip values.
How to Use Fibonacci Retracement Tool for Day Trading: A Comprehensive Guide
Introduction
For day traders, it is crucial to have knowledge of various technical analysis tools that can help them make informed decisions. One such tool is the Fibonacci retracement tool, which can be used to determine potential price levels during a market correction. In this article, we will discuss how to use the Fibonacci retracement tool while day trading.
Understanding Fibonacci Retracement Tool
The Fibonacci retracement tool is a popular technical analysis tool used to identify potential areas where price may retrace to during a market correction. It is based on the mathematical sequence discovered by the Italian mathematician Leonardo Fibonacci over 800 years ago. This sequence is a series of numbers in which each number is the sum of the two preceding ones: 0, 1, 1, 2, 3, 5, 8, 13, 21, 34, 55, 89, 144, and so on.
The Fibonacci retracement levels are drawn from the high and low of a market move. The retracement levels, represented by horizontal lines on a chart, indicate where the asset price could potentially retrace to during a correction. The commonly used retracement levels are 0.236, 0.382, 0.50, 0.618, and 0.786.
Using the Fibonacci Retracement Tool for Day Trading
Step 1: Identify the Trend
Before using the Fibonacci retracement tool, it is important to identify the trend of the asset. This can be done by analyzing the price action and identifying the high and low points of the trend.
Step 2: Draw Fibonacci Retracement Tool
Once the trend is identified, draw the Fibonacci retracement tool from the low point to the high point of the trend. Depending on the trading platform used, this can be done by selecting the Fibonacci retracement tool from the drawing tools and then clicking on the low and high points of the trend.
Step 3: Set Retracement Levels
After drawing the Fibonacci retracement tool, set the retracement levels to the commonly used levels of 0.236, 0.382, 0.50, 0.618, and 0.786.
Step 4: Identify the Gold Zone
The gold zone is the area between the 0.5 and 0.618 retracement levels. This area is known as the potential retracement area where the price of the asset could potentially bounce off from.
Step 5: Set Stop Loss and Take Profit Levels
Based on the Fibonacci retracement levels, set the stop loss and take profit levels. For instance, a stop loss of 54 pips and a take profit of 297 pips can be set. It is important to set these levels based on one’s own risk tolerance and trading strategy.
Step 6: Monitor Price Action
After setting the levels, monitor the price action closely. If the asset price retraces to the gold zone and bounces off it, it is likely to hit the first price target. The second and final price targets can also be achieved if the price continues to move in the expected direction.
Conclusion
Using the Fibonacci retracement tool can be a useful tool for day traders to determine potential areas of retracement during a market correction. By following the steps mentioned above, traders can use the tool effectively and make informed trading decisions. It is important to remember that no trading strategy is foolproof, and traders should always exercise caution while investing in the market.
Follow for More
If you found this article helpful, be sure to follow for more informative articles on day trading and technical analysis tools.

