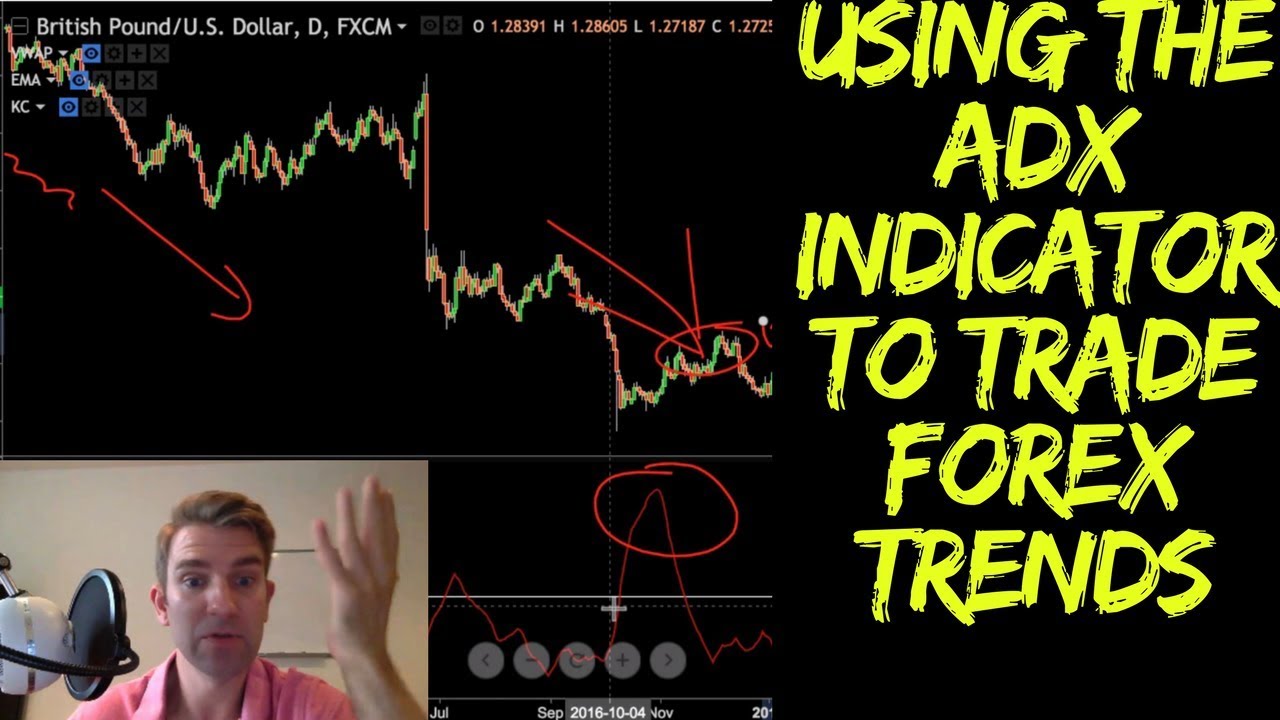
The ADX is a popular trend indicator that tells us the strength of a trend; it was created by Welles Wilder and is based on higher highs and lower lows. An ADX reading above 30 indicates a trending environment, while below 30 indicates a choppy environment. The ADX can be used to get involved in pullbacks or range expansion trades depending on individual strategy.
How to Make Money with the ADX Indicator: Understanding the Basics
As a price action trader, the ADX or Average Directional Index is one of my favorite indicators to use. In this article, I’ll discuss what the ADX is, where it comes from, and most importantly, how it can be used to make money in trading.
The ADX: What is it and What is it All About?
The ADX, also known as the Average Directional Index or Indicator, is a trend indicator that tells us the strength of a trend. It was developed and tweaked by the famous worldwide trader Welles Wilder and is based on the direction of the market in terms of higher highs and lower lows. It was originally intended for use in commodities and currencies, but can be applied to other markets as well.
Using the Average Directional Index
The ADX is available on most chart packages, including MT4 and InterTrader. Generally, we look at the 14-period ADX, but some traders use 20 or 30.
The ADX is based on the premise that a trend will give us high highs and lows that get progressively higher or lower respectively. The ADX puts more weight on an uptrend as it sees higher highs and more weight on a downtrend as it sees lower lows.
It’s essential to remember that the ADX isn’t directional; it doesn’t give us a signal as to whether the market is going up or down. Instead, it shows if the market is trending, and its definition of a trend is a series of higher highs or lower lows. Consequently, choppy markets will not give a high reading on the ADX, whereas trending markets will.
A high reading on the ADX (30 and above) is generally considered a trending environment, while a low reading is considered a choppy environment. Once we know this, we can develop a strategy based on ADX readings.
How to Use the ADX in Trading: A Few Strategies
One way of looking at the ADX is to say, “I want to look for a strategy that involves getting involved in a trend, such as buying pullbacks or looking for double tops.” We’re primarily looking for values above 30 that form spikes in the ADX, regardless of whether they are upsides or downsides in price.
When we have an ADX reading above 30, we want to get involved in a pullback. For example, when the ADX reading is above 30, and we see a pullback, that’s the time to go short.
Another way to use ADX is to get a heads-up that we’re due for a breakout from a range-bound environment if we want to trade range expansion. The ADX can help with that as when we’ve been sitting in a range for a long time; the ADX popping above 30 could indicate a potential trend. When that happens, it’s an opportunity to take a long or short position depending on the market direction.
Finally, another strategy could be to find range-bound markets where we only get involved when the market is in a range. This works exceptionally well in markets like the euro or the commodity markets.
Conclusion
The ADX is a popular technical indicator for traders, particularly those who use price action strategies. It’s easy to use, and its clear signals can be used to develop a range of trading strategies. Whether you want to trade trends or ranges, the ADX is an essential tool to add to your trading arsenal.

