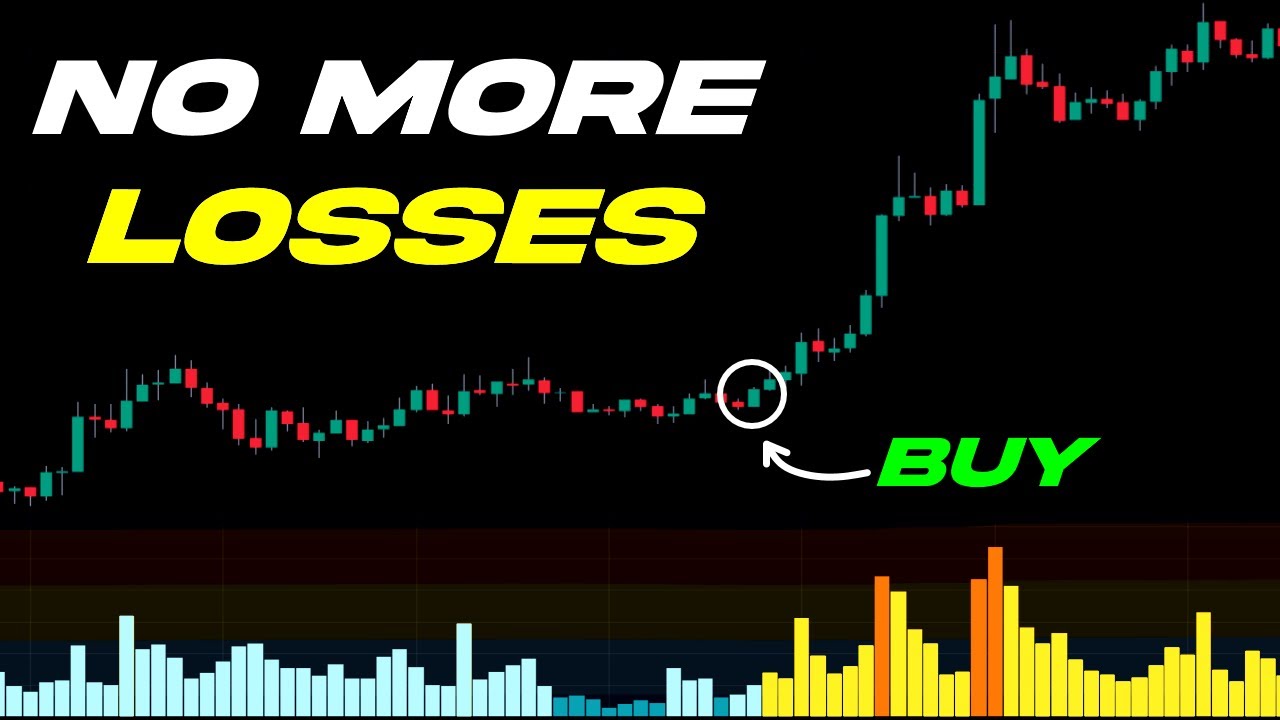
The key to predicting the price of an asset is volume. Knowing the bullish or bearish volume in the market is crucial to accurate predictions. Today’s video covers the top 3 volume indicators, including the Volume Flow and Heatmap Volume indicators, which help filter out sideways markets and eliminate losses. The VSA indicator shows what bigger players are doing in the market and displays real-time data. These indicators can be used with simple strategies to make profitable exchanges.
Using Volume Indicators to Predict Future Market Price
Introduction
If you are involved in trading assets, whether it is stocks, cryptocurrencies, or forex, knowing the price direction is crucial. One of the key components that determine whether the price of an asset will go up or down is volume. By understanding how much bullish or bearish volume is currently in the market, you can make an accurate prediction of whether the price will rise or drop. In this article, we will cover the top 3 volume indicators that allow you to make educated and accurate predictions of the future price.
The Volume Flow Indicator
In third place, we have a powerful yet straightforward volume indicator that can be used to identify trend switches in the market. The Volume Flow Indicator is based on the popular On Balance Volume (OBV) but with a vital change: The indicator values are no longer meaningless. The indicator’s value is positive in a bullish market and negative in a bearish market. By adding this indicator to the chart, you can filter out ranging or sideways markets.
Using the Volume Flow Indicator
To use the Volume Flow Indicator, head over to the indicator search tab and search for the Volume Flow Indicator made by Lazy Bear, add it to the chart. Next, search for the EMA indicator and add it to the chart to showcase a simple strategy with the Volume Flow Indicator. Set the EMA length to 100 and change the color to white to make it easier to see.
To show you a buy entry example, look for a spike in buy orders; this indicates an excess of bullish volume that has entered the market, pushing the price up. Check if the price is trading above the 100-period EMA and observe that the Volume Flow Indicator has turned positive, crossing above the zero line. This signals a bullish market, and you should enter into a buy position, putting the stop loss at the recent swing low. Your take profit should target a 1.5 times risk-to-reward ratio.
On the other hand, if the Volume Flow Indicator crosses below the zero line, this indicates the market has entered a bearish trend. Sell when the price is trading below the 100-period EMA and put the stop loss at the recent swing high. Your take profit should target a 1.5 times risk-to-reward ratio.
The Heatmap Volume Indicator
In second place, the Heatmap Volume Indicator allows you to filter out ranging or sideways markets and eliminate as many losses as possible using volume-based entry signals. The indicator colors the bars and candlesticks based on the amount of volume traded. By optimizing the indicator to only enter a position when the volume is at the medium level or above, you can ensure that your strategies become even more profitable.
Using the Heatmap Volume Indicator
To use the Heatmap Volume Indicator, search for it in the indicator search tab and select the indicator made by XD cow and add it to the chart. Head over to the indicator settings and navigate to the inputs tab, and set the high volume threshold to 1.5 and the medium volume threshold to 0.5. Only enter a position when the bar is colored in yellow, orange, or red. Look for a high volume in the market every time the price moves significantly.
For instance, if the price crosses below the 100-period EMA, there may not be enough volume to push the price down further. Do not enter into a sell position in this case. Only enter into a position when the Volume Indicator is displaying a medium or high volume. Follow the same procedure for buy positions.
The Volume Spread Indicator
The Volume Spread Indicator is the most valuable volume indicator in the market because it indicates what whales or bigger players are doing in the market. This non-lagging indicator allows you to see real-time data from the market and identify the trend’s strength.
Using the Volume Spread Indicator
To use the Volume Spread Indicator, search for it in the indicator search tab, select the indicator made by this trading view user, and add it to the chart. A ranging market has a low volume level, while a trending market has an increasing volume level. Look for a yellow or red bar to signal entry for a sell position, depending on the volume amount in the market. For a buy position, the bar should be green, yellow, or red.
Conclusion
By using these volume indicators, you can accurately predict the future price direction of an asset. Always remember to analyze the historic price trends, news events, and other indicators to make an informed decision. Happy trading!

