Learn a simple trading strategy with the Optimize Trend Tracker indicator on tradingview.com. Adjust settings and add the trend meter for best results. Get a buy signal when the blue line crosses the purple line. The strategy also works for predicting moves in the downside.
How I Made Over $1,300 on One Trade Using a Simple Strategy
Trading can be a lucrative way to make money, but it can also be a risky venture. In this article, I will share with you my experience of making over $1,300 on one trade using a very simple strategy. I will also provide step-by-step instructions on how you can implement this strategy yourself and potentially make profits.
Using Tradingview.com to Search for Indicators
The first step to implementing this strategy is to head over to tradingview.com and search for the “optimize trend tracker” indicator. This indicator is based on the exponential moving average (EMA) and the variable oscillator (VAR).
After you have located the indicator, go to the settings and make sure that the EMA is set to 7 and the percentage is set to 1.5. This will provide you with the optimal settings for using the indicator.
Adding the Trend Meter Indicator
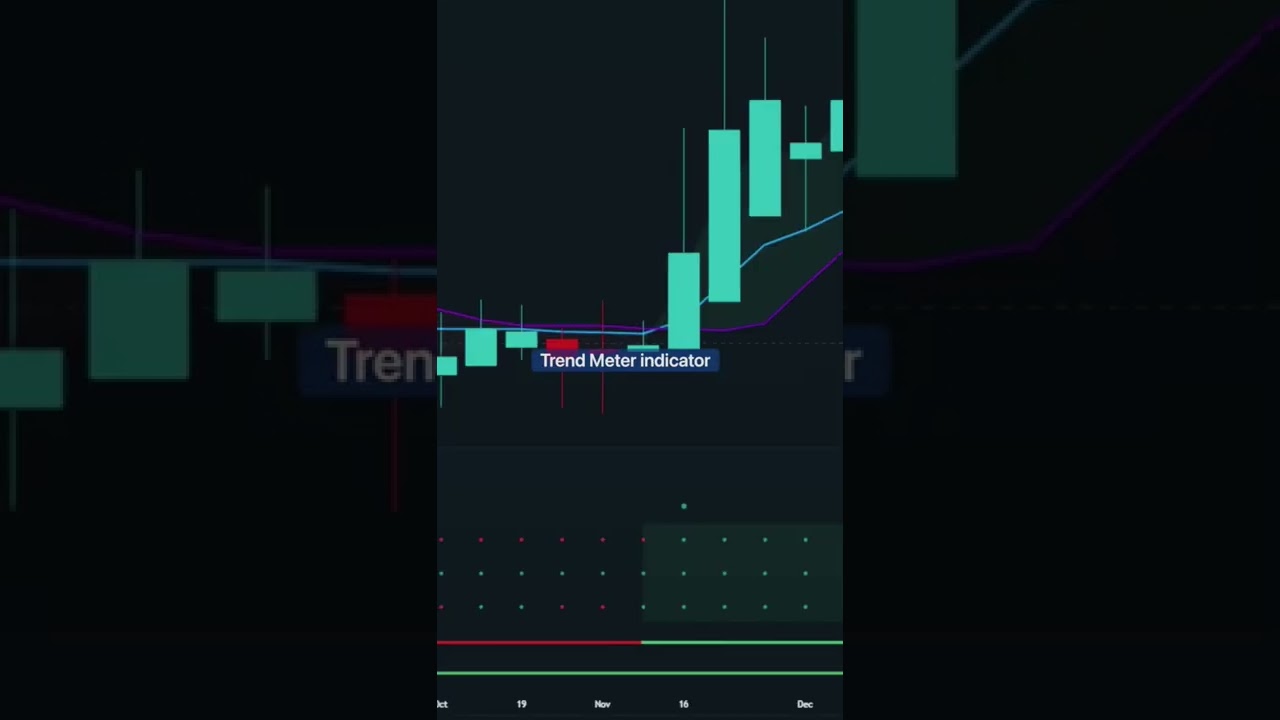
Next, you want to add the trend meter indicator to your chart. This indicator is used to confirm the trend of the market. The trend meter consists of two lines – a blue line and a purple line. When the blue line crosses the purple line and four dots are shown, a buy signal is provided.
Using the Strategy
Now that you have added the indicators to your chart, you can start using this strategy to buy and sell positions. For a buy position, wait until the blue line crosses the purple line and four dots are shown. This indicates a buy signal. Enter a position with a stop loss at the previous low and a take profit at 1:1.5 risk/reward ratio.
For a sell position, wait until the blue line crosses the purple line and four dots are shown, but in the opposite direction. This indicates a sell signal. Enter a position with a stop loss at the previous high and a take profit at 1:1.5 risk/reward ratio.
Example of the Strategy in Action
To further illustrate the effectiveness of this strategy, let me share with you a recent trade I made using this strategy. I was monitoring the chart of BTC/USD and noticed that the trend meter was indicating a buy signal. I entered a long position at $47,500 with a stop loss at $47,000 and a take profit at $48,750 (1:1.5 risk/reward ratio).
Within a few hours, the price of BTC/USD reached my take profit level, and I closed my position, making a profit of over $1,300.
Conclusion
In conclusion, trading can be a profitable venture when you use effective strategies. The strategy I have shared with you involves using the “optimize trend tracker” and trend meter indicators to identify buy and sell signals. By following the steps outlined here, you can potentially make profits like I did. However, trading always carries a risk, so make sure to manage your risk properly and trade responsibly.
