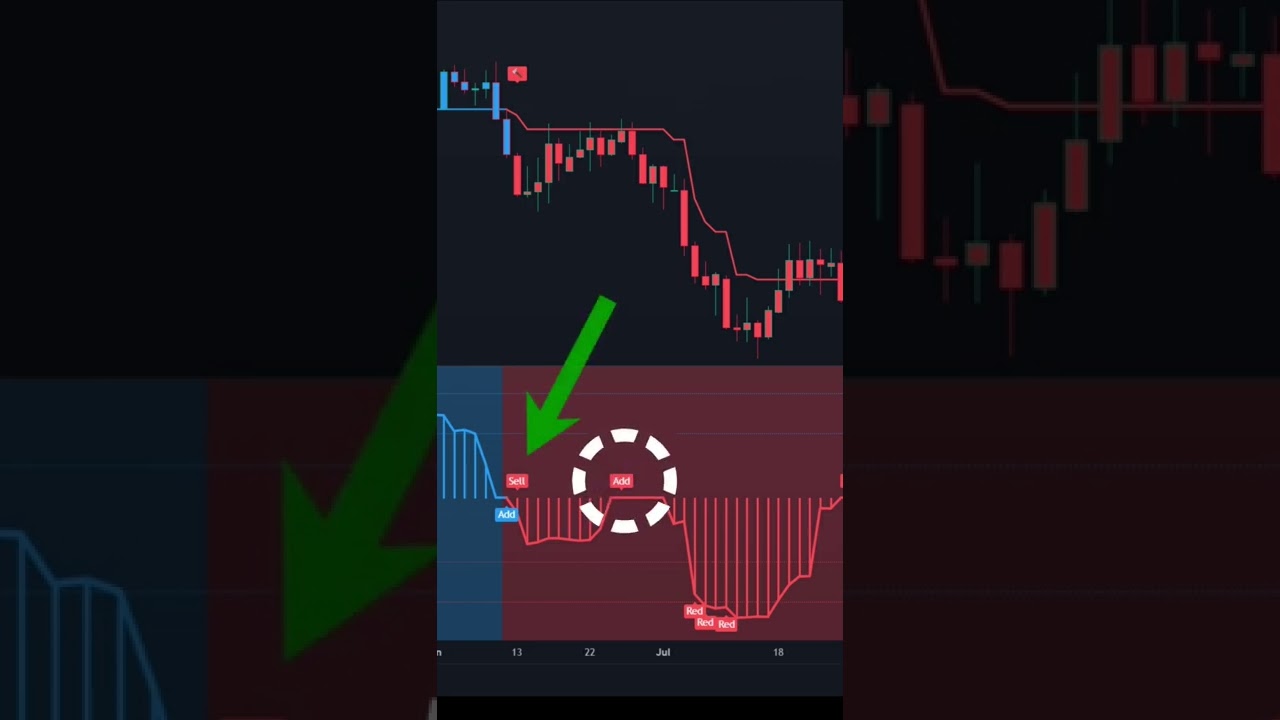
Advanced trading strategy using two powerful indicators on Trading View can result in surprisingly profitable trades. Follow instructions carefully for best results.
Discover the Ultimate Trading Strategy with Two Powerful Indicators
When it comes to trading, every trader requires a reliable and effective strategy to achieve their financial goals. But with so many trading indicators available, it can be challenging to identify the most suitable indicators to use for profitable signals.
In this article, we will introduce you to two powerful indicators that have the potential to change your trading game for the better. These two indicators, when used together correctly, can provide you with high-quality trade signals and help you execute profitable trades successfully.
TradingView: A Powerful Trading Indicator Platform
TradingView is one of the most popular trading platforms in the world right now, due to its advanced features and the range of indicators available on the platform. The platform has an extensive indicator library that traders can use to develop robust trading strategies.
The two powerful indicators that we will be discussing in this article can be found on TradingView. These indicators are the Follow Line Indicator and Angle Attack Follow Line Indicator. Keep reading to discover how these indicators work and how to use them to develop a winning trading strategy.
Follow Line Indicator: The First Powerful Trading Indicator
The Follow Line Indicator is a unique indicator that is designed to help traders spot current trends and swiftly react to them. The indicator is straightforward to use, and traders can use it to identify support and resistance levels, which are crucial in any trading strategy.
To access the Follow Line Indicator on TradingView, type “Follow Line Indicator” in the search box within the indicator section. The first result that appears is what you need. The blue line or gray-filled areas that the indicator shows on the chart represent the support and resistance levels, respectively.
If the current price is below the blue line, it indicates a bearish trend, and if the price is above the line, it indicates a bullish trend. With this information, traders can take action based on the market direction in real-time.
Angle Attack Follow Line Indicator: The Second Powerful Trading Indicator
The Angle Attack Follow Line Indicator is a powerful tool that helps traders find the best entry and exit points in the market. The indicator is designed with advanced algorithms that analyze market prices and generate profitable signals based on established support and resistance levels in the market.
To access the Angle Attack Follow Line Indicator on TradingView, type “Angle Attack Follow Line Indicator” in the search box within the indicator section. The green arrow that appears on the chart represents a buy signal, and the red arrow represents a sell signal.
With these two powerful indicators, you can set up a trading system that provides high-quality trade signals, and execute profitable trades. Now, let’s look at how you can use the indicators together to develop an effective trading strategy.
The Ultimate Trading Strategy using Follow Line Indicator and Angle Attack Follow Line Indicator
Step 1: Confirming Trend Direction
The first step in developing the ultimate trading strategy with these two indicators is to determine the trend direction. Use the Follow Line Indicator to identify the trend direction by looking at whether the current price is above or below the blue line.
If the price is above the blue line, it indicates a bullish trend, and if the price is below the blue line, it indicates a bearish trend. Once you have confirmed the trend direction, proceed to the next step.
Step 2: Searching for the Entry Signal
The Angle Attack Follow Line Indicator provides a powerful entry signal that helps traders identify the best entry points in the market. When the green arrow appears on the chart, it suggests a buy signal, and when the red arrow appears, it suggests a sell signal.
Once you have established the trend direction, monitor the Angle Attack Follow Line Indicator for entry signals. If the green arrow appears during an uptrend, it is a buy signal, and if the red arrow appears during a downtrend, it is a sell signal.
Step 3: Executing the Trade and Placing Stop Loss and Profit Targets
Once you have entered the market based on the Angle Attack Follow Line Indicator’s signals, you need to protect your trades with stop-loss orders to limit potential losses. The stop loss should be placed at the recent swing high for a sell signal and recent swing low for a buy signal.
For the profit targets, you should aim for a profit-to-loss ratio of at least 1:1.5. When a red signal is created, it indicates a good time to book profits.
Step 4: Avoiding the Volatile Market
Finally, it is essential to avoid trading in volatile markets because the signals generated by these indicators may not be reliable. It is better to wait for the market to stabilize before entering trade positions in such situations.
Wrapping Up
These two powerful indicators, Follow Line Indicator and Angle Attack Follow Line Indicator, can work together to develop a winning trading strategy that helps you achieve your financial goals. Remember to always confirm the market trend direction, monitor the Angle Attack Follow Line Indicator for entry signals, and protect your trades with stop-loss orders.
By following the above steps, you can develop a robust and reliable trading system that helps you make profitable trades consistently. Get started now and watch your trading profits soar.

