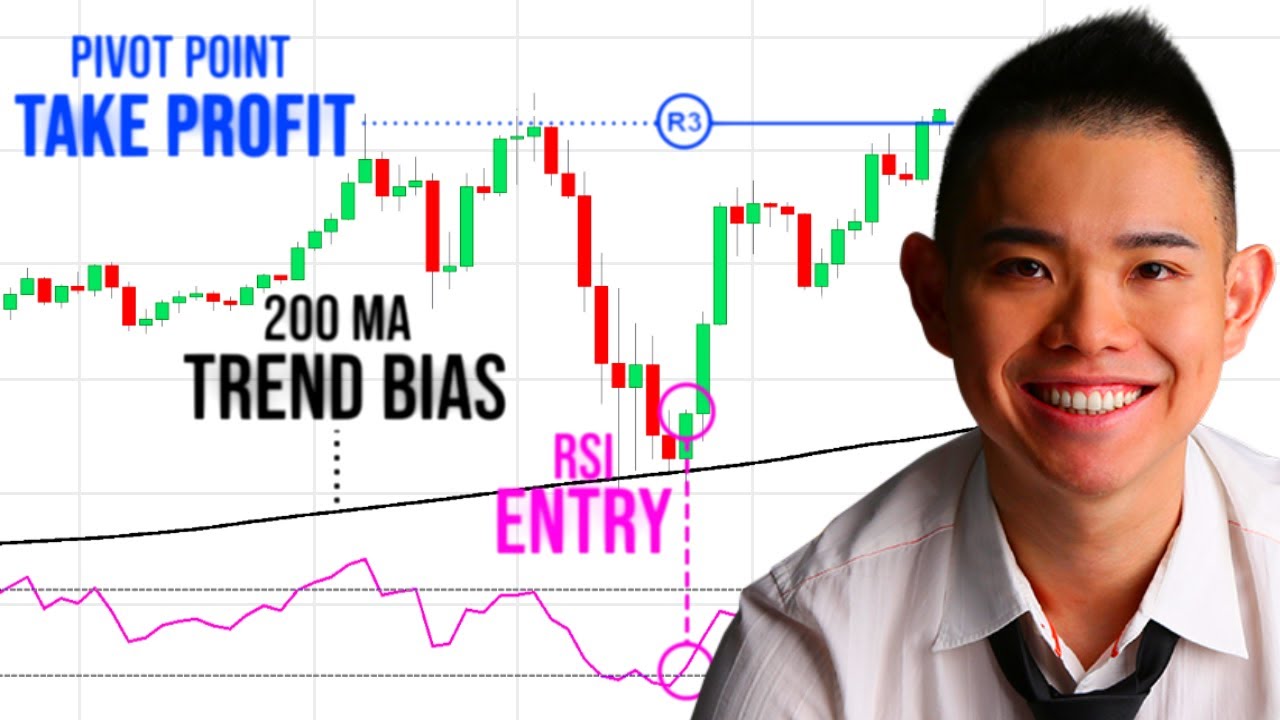
In this trading tutorial, the speaker discusses the dangers of using too many related indicators and how to categorize indicators by their purpose. They also explain how to use specific indicators to identify market conditions, areas of value, entry triggers, and trade management.
Combining Trading Indicators Like a Pro: How to Better Time Your Entries and Exits
Introduction: Why Correlated Indicators Can Be a Problem
Market Condition: Identifying the Trend and Volatility
Area of Value: Finding Potential Buying or Selling Pressure
Entry Trigger: Confirming a Trading Opportunity
Trade Management: Managing Risk and Profit Targets
Conclusion: Don’t Just Splash Indicators on Your Chart
Introduction: Why Correlated Indicators Can Be a Problem
Many traders use multiple indicators on their charts in an attempt to get a better interpretation of market movements. However, simply adding more and more indicators can lead to clutter and confusion, especially if those indicators are correlated. In this article, we’ll explore how to combine trading indicators like a pro so that you can better time your entries and exits and get better trading results.
Market Condition: Identifying the Trend and Volatility
The first purpose that trading indicators can serve is to help you understand the market conditions. This includes identifying the trend and volatility. Two indicators that can help you do this are the moving average and the Average True Range (ATR).
For the moving average, you can use the 200 period moving average to identify the trend. If the price is consistently below the moving average, the overall market is in a downtrend, and you may want to look for selling opportunities. On the other hand, if the price is consistently above the moving average, you may want to look for buying opportunities.
The ATR, on the other hand, measures volatility in the market, and can help you understand whether volatility is high or low. This can be useful in determining the appropriate trading strategy for different market conditions.
Area of Value: Finding Potential Buying or Selling Pressure
The second purpose that trading indicators can serve is to help you find potential buying or selling pressure. This can be done using tools like the moving average or stochastic.
For example, the 50 period moving average can be used to identify areas of value where potential buying pressure might come in. If the price repeatedly respects the 50 period moving average as a support level, it can be a potential area for buying opportunities. Similarly, the stochastic can be used to identify oversold or overbought conditions, signaling potential buying or selling pressures.
Entry Trigger: Confirming a Trading Opportunity
Once you’ve identified the market conditions and potential areas of value, the next step is to confirm a trading opportunity using an entry trigger. There are many different indicators that can be used as entry triggers, including the Relative Strength Index (RSI) or the Moving Average Convergence Divergence (MACD).
The key is to choose an indicator that complements the market conditions and area of value you’ve already identified. This will help you confirm your trading intuition and increase your chances of success.
Trade Management: Managing Risk and Profit Targets
Finally, trading indicators can be used to manage risk and profit targets. For example, you can use indicators like the Bollinger Bands or Fibonacci retracements to set stop loss levels or profit targets.
By setting these levels based on technical analysis, you can better manage your risk and maximize your profits.
Conclusion: Don’t Just Splash Indicators on Your Chart
In conclusion, combining trading indicators like a pro requires an understanding of their purpose and how they complement each other. Instead of just splashing any random indicator on your chart, take the time to understand how each one can add value to your trading strategy. By using market condition, area of value, entry trigger, and trade management indicators, you can better time your entries and exits and get better trading results.

