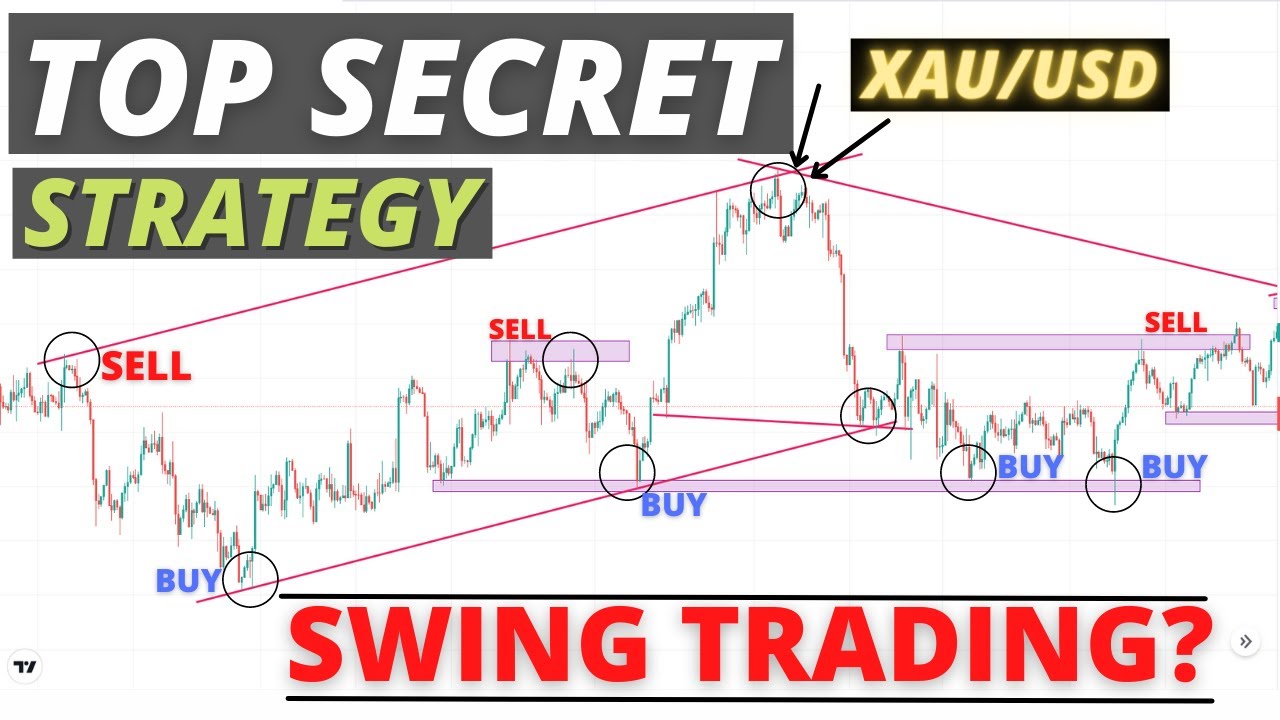
The trader outlines a strategy for trading XA USD on a 4-hour time frame. They draw support and resistance areas and use trendlines and candle formations for confirmation of trades. They set stop losses and aim for a risk to reward ratio of 1:2. They provide examples of both buy and sell trades using this strategy. They encourage viewers to comment with any questions and to subscribe to their channel.
Maximizing Your Trades: A Guide to Trading XA-USD Asset in Four Hour Time Frame
Introduction
– Welcome back to my YouTube channel
– Trading XA-USD Asset in four hour time frame
– Drawing a support area and waiting for market’s rejection to take trade
Creating Resistance Areas for Best Entry Points
– Resistance at high point and waiting for market’s rejection for best entry point for sell trade
– Stop loss at resistance area and risk to reward ratio of 1:2
– Winning trade with market’s rejection from resistance zone
Confirmation of Trades with Support Zones
– Set up support zone to see market movements
– Winning trade with confirmation of buy trade from support zone
– Draw trendline from one point to another to understand market movements
– Confirmation of sell trade with rejection from trendline for third time
Establishing a Risk-Free Trade
– Resistance zone created for best entry point for sell trades
– Winning trade with rejection after red candle formed and confirmation of cell trade
– Stop loss at resistance zone and risk to reward ratio of 1:2
Spotting Trends with Trendlines
– Draw trendline to understand market movements on lower points
– Winning trade with confirmation of cell trade from trendline and resistance area
– Confirmation of cell trade with breakage of triangle pattern
Conclusion
– Understanding the strategy for trading XA-USD Asset
– Asking for clarification and leaving comments
– Don’t forget to like and subscribe to the YouTube channel

