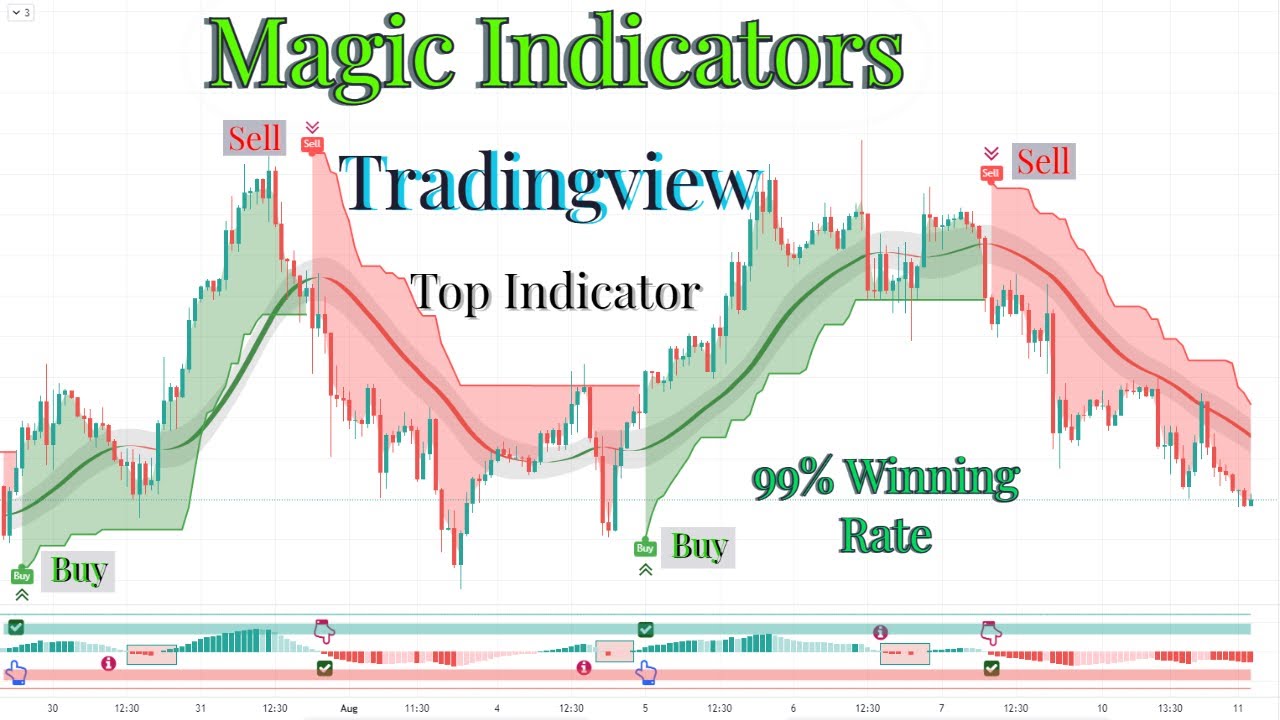
A youtuber shares a secret trading step using the Design Indicator that can be used in different ways such as momentum and trend indicator. The setup uses Super Trend and Design Histogram as trading tools, and should not trade against the trend. The video includes examples of placing buy and sell orders with a risk to reward ratio of 1:2, and recommended settings for the indicators on Trading View.
Secret Trading Step on Trading View with Design and Super Trend Indicators
Introduction: Understanding Trading Tools
When it comes to trading, having the right tools and indicators in place is crucial. In this video by FX Accurate, we learn about a secret trading step on the Trading View platform that uses the Design Histogram Indicator in combination with the Super Trend Indicator. We will look at how this setup can help execute profitable trades.
What Are Super Trend and Design Indicators?
Before diving into the setup, let us understand what the Super Trend and Design Indicators are. The Super Trend is a line that fluctuates between red and green. When the line is red, the market is in a downtrend, and when it’s green, the market is in an uptrend. On the other hand, the Design Indicator is a famous trading indicator that can be used as both a momentum and trend indicator. The Design Histogram is the indicator at the bottom of the chart that complements the Design Indicator.
The Trading Setup: Using Super Trend and Design Indicators
Now, let’s get to the trading setup using these indicators. The first condition is that when the Super Trend changes into an uptrend, the Design Trend Indicator should be green, and the Design Histogram should also be green. From here, we should place a buy order, and our stop loss should remain at the Design Trend Indicator. The risk to reward ratio should be 1:2.
Similarly, when the Super Trend changes into a downtrend, the Design Trend Indicator should be red, and the Design Histogram should also be red. We should place a sell order, and our stop loss should remain at the Design Trend Indicator. The risk to reward ratio should be 1:2.
It’s important to mention that we should never trade against the trend.
Examples of Trades Using the Trading Setup
Now let’s look at examples to understand this trading strategy better. The first trade was on EuroCAD’s one-hour chart. The Super Trend changed into a downtrend, the Design Trend Indicator was red, and the Design Histogram was also red. Therefore, we placed a sell order with a stop loss at the Design Trend Indicator – the risk to reward ratio was 1:2. Our trade was successful, and we won.
In the second trade, the Super Trend changed into an uptrend, the Design Trend Indicator was green, and the Design Histogram was also green. We placed a buy order – stop loss at the Design Trend Indicator – and won with a 1:2 risk to reward ratio.
There were a few losing trades, but that’s part of trading. The key takeaway is that this trading strategy can create profitable trades if executed correctly.
Setting Up the Super Trend and Design Indicators
To set up the Super Trend Indicator on Trading View, we search for ‘Super’ in the search box and choose the Super Trend option. We should change some settings to remove false signals: replace ATR period 10 with 7 and ATR multiplier 3 in place of 4.6.
To set up the Design Indicator, we search for ‘Design’ in the search box and select the Trend Indicator AV2 and Trend Indicator BV2 option. Next, we should replace EMA length 14 with 34 and EMA length smoothing 14 in place of 27. We can choose the color of the strip according to our preference.
Conclusion: Subscribe for More Trading Tips
In conclusion, using the Design Histogram Indicator in combination with the Super Trend Indicator can help create profitable trades. However, it’s crucial to watch the trend and follow the trading setup. If you’d like to learn about more trading tips, subscribe to FX Accurate’s channel.

