Learn how to make profitable trades with just one indicator on Trading View by following simple steps to adjust settings and read prices.
How to Find a Highly Profitable Trade Using Only One Simple Indicator
Trading, especially for beginners, can be quite challenging. It requires knowledge, patience, discipline, and a lot of hard work. Finding profitable trades can also be quite difficult, as there are so many factors to consider. However, there is a simple way to find highly profitable trades by using just one indicator.
This article will guide you on how to use a particular indicator to identify profitable trades. The indicator is known as the Market Structure Break. With this indicator, you can determine when it’s time to buy or sell, and you can be confident that you’re making the right decision.
Step One: Open Your Trading View
The first step is to open your trading view account. Trading view is an online platform for traders. It’s a powerful tool that allows traders to view real-time data, analyze trends, and make trades. Once you’re on the trading view website, sign in to your account.
Step Two: Type “Market Structure Break” in the Search Bar
After signing in, locate the search bar at the top of the page. Type in “Market Structure Break” in the search bar and hit enter. This will take you to a page with several indicators related to the Market Structure Break.
Step Three: Click on “Market Structure Break” by Emrec Haybee
From the list of indicators, click on the “Market Structure Break” by Emrec Haybee. This will take you to a page with more information about the indicator.
Step Four: Go to the Settings Menu
Once you’re on the Market Structure Break page, locate the settings menu icon, which looks like a gear icon. Click on the gear icon to open the settings menu.
Step Five: Change the Settings
In the settings menu, change the “Price Line Width” option to “3.” Also, change the “Color” option to “Green” for the “Up” trend and “Red” for the “Down” trend. Ensure that the “Show Zigzag” option is checked so that the zigzag is visible.
Step Six: Wait for a Trade Setup
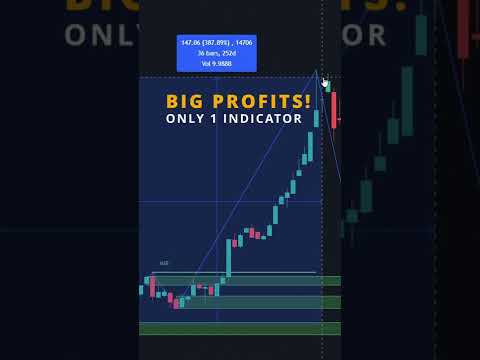
Once you’ve adjusted the settings to your liking, you can then wait for a trade setup. Wait for the price to enter a trend, either an uptrend or a downtrend. Once the price has broken above the green area, that’s the time to buy. When the price breaks below the red area, that’s the time to sell.
Step Seven: Change the Time Frame
To increase the accuracy of the trades, you can change the indicator to a shorter time frame. To do this, go back to the settings menu, click on “Inputs,” and change the value in the “Length” option to a smaller number.
Conclusion
Using the Market Structure Break indicator is an effective and easy way to find highly profitable trades. By following the steps outlined in this article, you can successfully use this indicator to determine when to buy or sell. However, it’s important to note that while this indicator is a great tool, it’s not foolproof. Always do your research and analysis before making any trades. That way, you can minimize your losses and maximize your profits.
