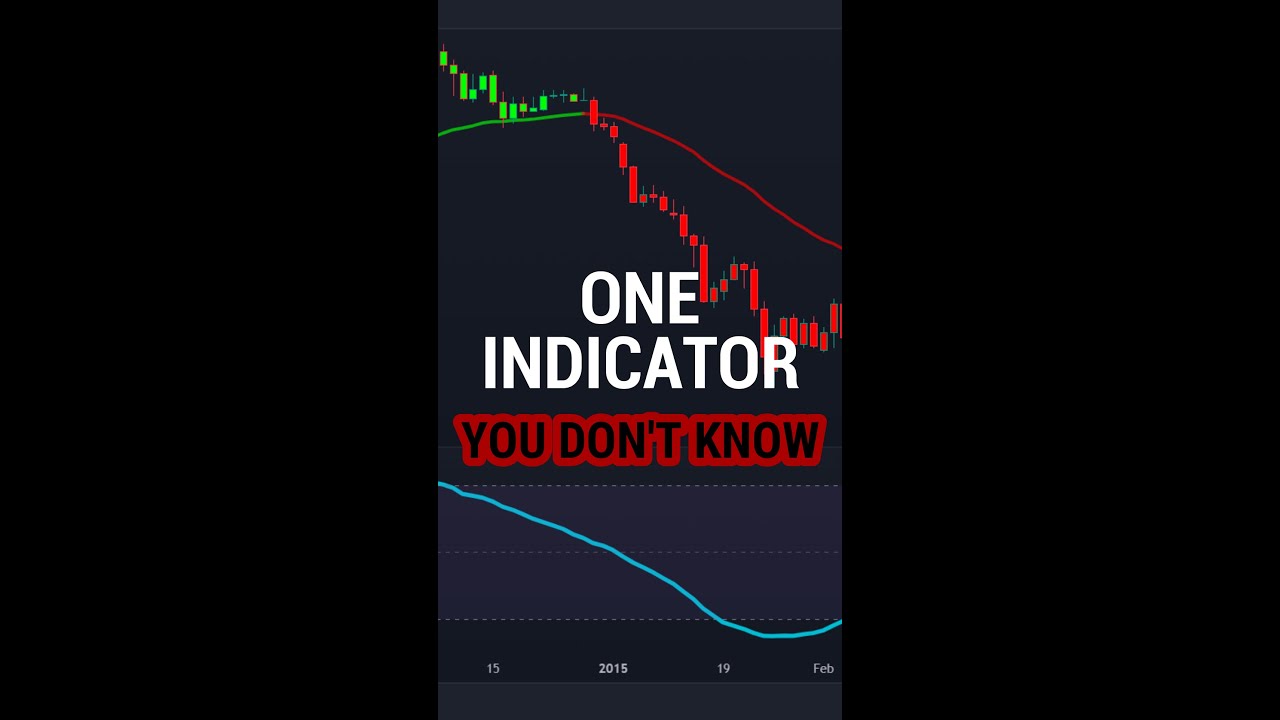
Learn about the trend bars indicator which can be used for scalping, swing trading, or analyzing past signals. Buy when RSI is above 50 and candles are green, sell when RSI is below 50 and candles turn red. Book profit when RSI line crosses 70 levels and negative candles appear. Use it for free on TradingView by searching for “cmma trend bars” and adjusting the RSI settings.
Introduction:
There are numerous indicators in the world of trading that one can use to make profits. However, some indicators are more complex than others, and as a beginner in trading, it might take you some time to understand the more complex ones. Today, we’ll take a look at an indicator called Trend Bars that is suitable for scalping, swing trading or merely looking at past signals. It can be used on any market and any timeframe; it’s called Trend Bars.
What is Trend Bars?
Trend Bars is a technical indicator that traders use to identify market trends. It works by observing the relative strength index (RSI) line, which typically goes above or below the 50 levels. When the line is below 50, it is a signal to sell; when it is above 50, it is a signal to buy. Additionally, the candles or line will turn red when it’s time to execute a sell trade and green when it’s time for a buy trade. It’s that easy.
How to use the Trend Bars?
To use the Trend Bars, you need to follow the steps below.
1. Search for Trend Bars on Tradingview
Start by going to Tradingview and searching for Trend Bars. If you’re not already familiar with Tradingview, it’s an online trading platform that provides investors with a wide range of charts, market data, and analysis tools.
2. Locate the Trend Bars Indicator
Once you’re on Tradingview, look for the Trend Bars indicator. If you’re unsure where to find it, type “Chris Moody Trend Bars” into the search box, and the indicator will appear.
3. Customize the Indicator
To make the Trend Bars work, customize the RSI settings. Remove the RSI, and change the color to an RSI-based moving average. Once this is done, the setup is ready to use.
4. Interpret the Signals
When trading using the Trend Bars, observe that the RSI line should go below the 50 levels while the candles or line turn red if it’s time to execute a sell trade. Similarly, if the RSI indicator is above the 50 levels, and the candles or the line are in a green color, it’s time to execute a buy trade. If the RSI line crosses the 70 levels, book profits if there are negative candles in the market.
Advantages of using the Trend Bars Indicator
1. Works with Any market
Trend Bars can be used on any market, including Forex, stocks, and commodities.
2. Suitable for Different Time Frames
It works on any time frame, which means that traders can use it for scalping and swing trading; time frame is up to the trader.
3. Easy to use
The Trend Bars indicator is simple to use: just observe the color of the candles and the RSI values.
4. Can Be Used for Free
The Trend Bars indicator can be used for free, and no subscription is needed. Anyone who has a Tradingview account can use it.
5. Assured Results
As a proven reliable indicator, Trend Bars can provide reliable signals that lead to profitable trades.
Bottom line
The Trend Bars is a simple yet effective trading indicator that can assist traders in making profits. Once you set up the indicator, it becomes easy, any trader can use it regardless of experience or level of knowledge. Remember, always apply proper risk management when trading.

