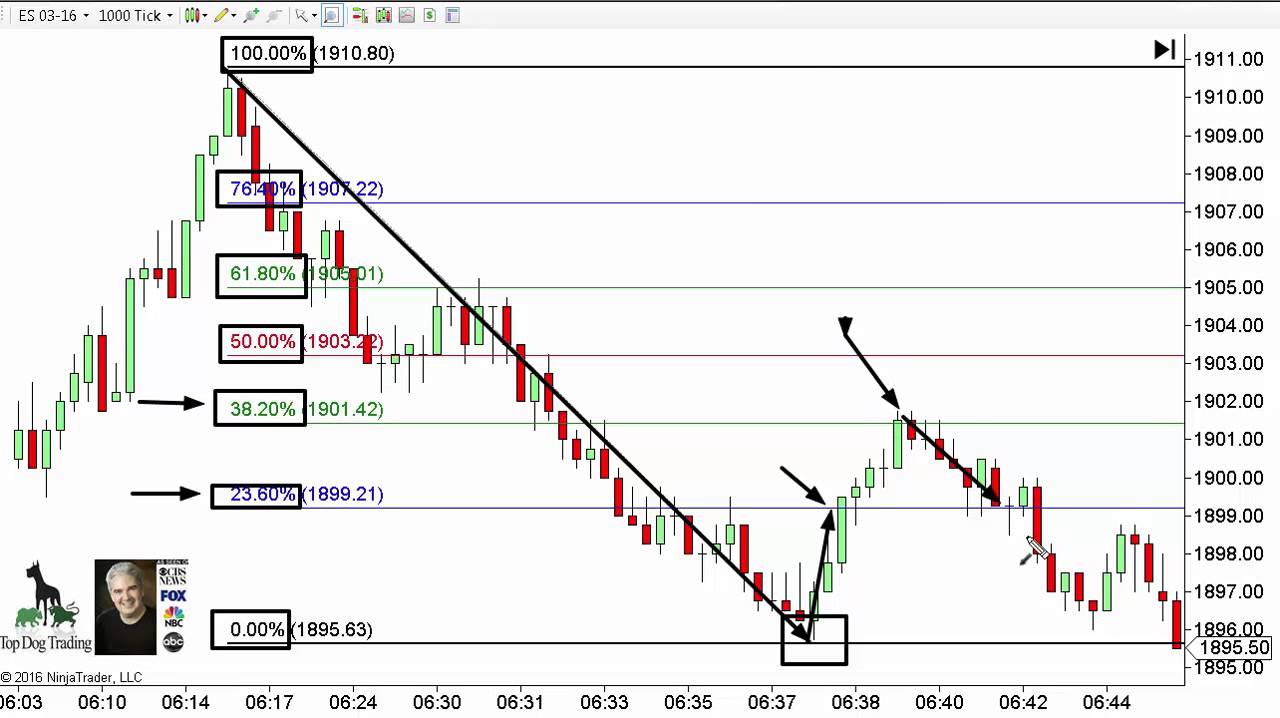
This video discusses Fibonacci retracement levels as support and resistance lines for day trading. The cycle indicator is used for time and price confluence.
Day Trading Rules: Using Fibonacci Retracement Levels
Introduction
As a day trader, understanding the market’s movement is essential for a successful trade. In this video series, Dr. Barry Burns from Tough Dog Trading discusses Fibonacci retracement levels, which are critical support and resistance lines used to determine how far the market will retrace after an impulse move before continuing in the direction of the trend. In this article, we will delve deeper into these retracement levels and their application in day trading.
What are Fibonacci Retracement Levels?
Fibonacci retracement levels are plotted on the chart after an impulse move to find how far the market will retrace before continuing in the direction of the trend. The levels are a percentage of how much the market retraces back towards the initial impulse move. The levels used are 0%, 23.6%, 38.2%, 50%, 61.8%, 76.4%, and 100%.
Drawing Fibonacci Retracement Levels
To draw Fibonacci retracement levels, start at the beginning of the impulse move and bring the line down to the bottom. The numbers will be drawn on the chart, giving potential prices where the market could top-out.
Determining Which Level Will Be the Final Resistance Level
The critical question is determining which of the Fibonacci levels will be the final resistance level that will hold, and the market will go back in the direction of the trend. To do that, we need to understand the confluence of time and price. The Fibonacci levels give potential prices, while the cycle indicator helps determine time, where the market will put in a high and continue back in the direction of the trend.
The Importance of the Cycle Indicator
The cycle indicator is a tool used to determine the timing of market movements. It indicates when a cycle is topping or bottoming, and when it turns from green to red, it gives us the key element to match that with the price level where the market could top-out.
Using Fibonacci Retracement Levels in Day Trading
Using Fibonacci retracement levels and the cycle indicator, day traders can determine the confluence of time and price, the precise entry point to enter the market for a short in the direction of the trend.
Conclusion
Day trading rules using Fibonacci retracement levels and the cycle indicator is essential to determine the market’s movement in the direction of the trend. It is a tool that helps traders understand the confluence of time and price, making trading decisions faster, more efficient, and ultimately more successful.

